
About
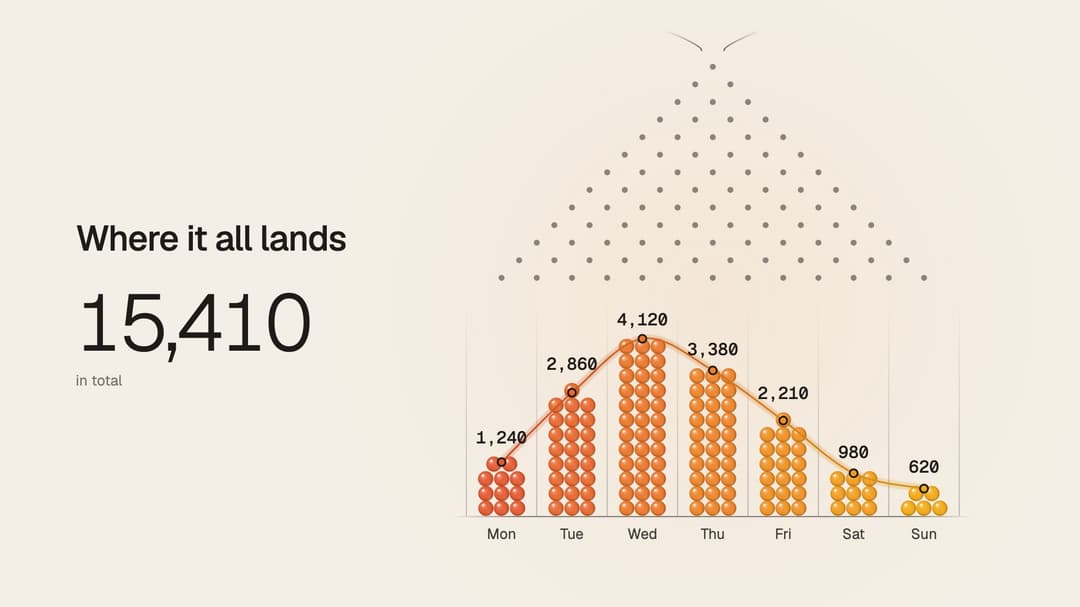
Galton Board Chart is a data animation for Remotion videos. Makes a number, comparison or trend visible. Plays 7.3 seconds in 16:9, 9:16 and 1:1, with editable text, items, colors and fonts.
Built with React and Tailwind. Copy the prompt and paste it into Claude Code, Cursor or Lovable: your agent adds Galton Board Chart to your project and fits it to your theme.
Code
How Galton Board Chart is used: the demo's code. The component's own source comes with a free account.
Usage.tsx
// Built with Remotion - https://remotion.pro/license
import { Composition } from "remotion";
import { Component } from "./video/galton-board-chart/galton-board-chart";
import { schema, defaults } from "./video/galton-board-chart/galton-board-chart.schema";

export const GaltonBoardChartComposition = () => (
  <Composition
    id="galton-board-chart"
    component={Component}
    schema={schema}
    defaultProps={defaults}
    durationInFrames={220}
    fps={30}
    width={1920}
    height={1080}
  />
);
Dependencies
More by 21st
View all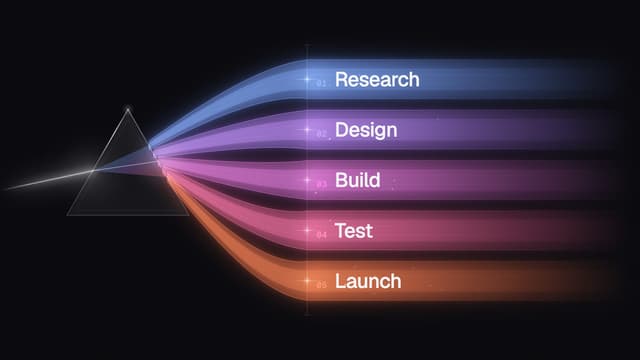
Prism Spectrum List
59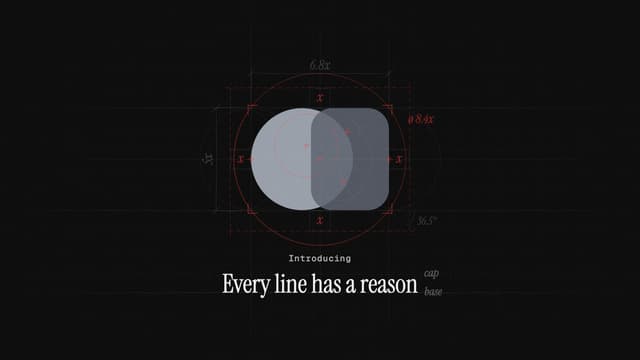
Logo Construction Lines
48
Polyrhythm Orbits
33
Live Transaction Alerts
28
Shattered Title Assembly
27
Metal Card Reveal
25
Differential Growth
24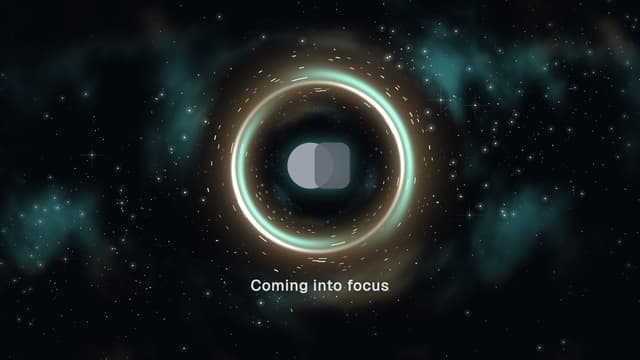
Gravitational Lens Logo
24