About
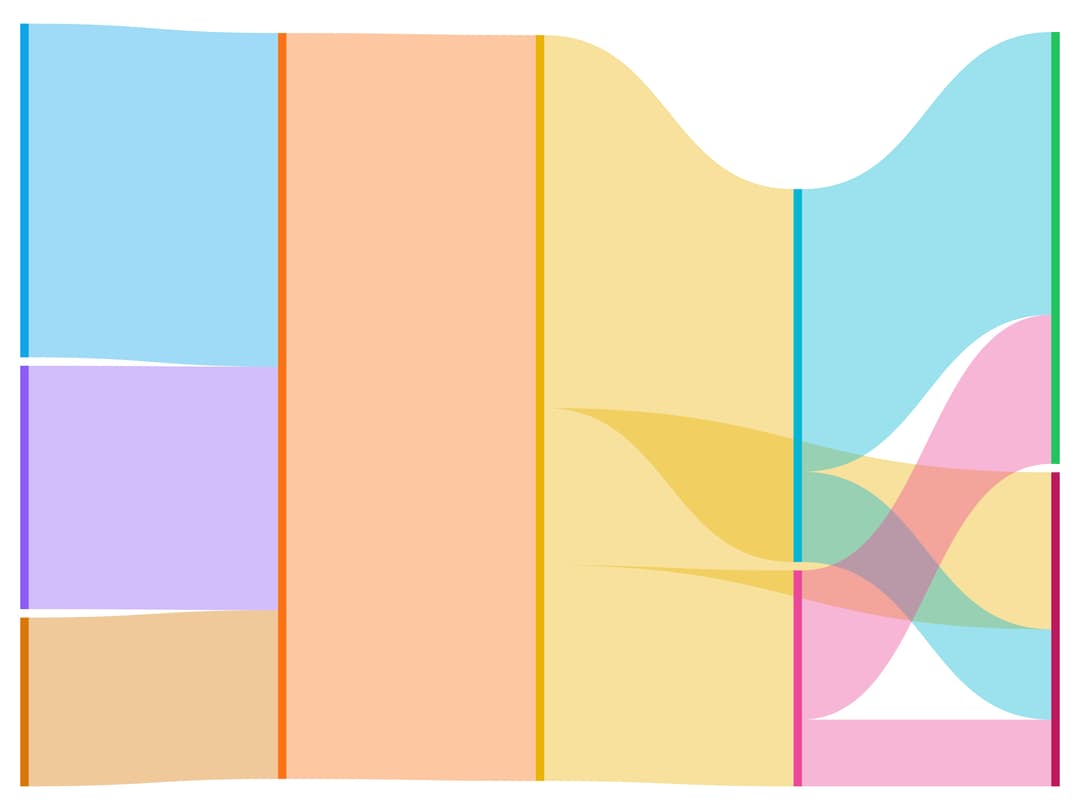
A flow diagram chart built on Apache ECharts that visualizes how a quantity moves between stages (e.g. funnel or budget flows) through animated, colored nodes and links.
Built with React and Tailwind. Copy the prompt and paste it into Claude Code, Cursor or Lovable: your agent adds ECharts Sankey Chart to your project and fits it to your theme.
Code
How ECharts Sankey Chart is used: the demo's code. The component's own source comes with a free account.
Usage.tsx
"use client";

import {
  EChartsSankeyChart,
  type SankeyData,
  type ChartConfig,
} from "@/components/ui/echarts-sankey-chart";

// Data pipeline - sources through processing to destinations
const data: SankeyData = {
  nodes: [
    { name: "API" },
    { name: "Database" },
    { name: "Logs" },
    { name: "Ingestion" },
    { name: "Transform" },
    { name: "Analytics" },
    { name: "MLPipeline" },
    { name: "Dashboard" },
    { name: "Archive" },
  ],
  links: [
    { source: 0, target: 3, value: 85000 },
    { source: 1, target: 3, value: 62000 },
    { source: 2, target: 3, value: 43000 },
    { source: 3, target: 4, value: 190000 },
    { source: 4, target: 5, value: 95000 },
    { source: 4, target: 6, value: 55000 },
    { source: 4, target: 8, value: 40000 },
    { source: 5, target: 7, value: 72000 },
    { source: 5, target: 8, value: 23000 },
    { source: 6, target: 7, value: 38000 },
    { source: 6, target: 8, value: 17000 },
  ],
};

const chartConfig = {
  API: {
    label: "API Events",
    colors: {
      light: ["#0ea5e9"],
      dark: ["#38bdf8"],
    },
  },
  Database: {
    label: "Database",
    colors: {
      light: ["#8b5cf6"],
      dark: ["#a78bfa"],
    },
  },
  Logs: {
    label: "Log Files",
    colors: {
      light: ["#d97706"],
      dark: ["#fbbf24"],
    },
  },
  Ingestion: {
    label: "Ingestion Layer",
    colors: {
      light: ["#f97316"],
      dark: ["#fb923c"],
    },
  },
  Transform: {
    label: "Transform",
    colors: {
      light: ["#eab308"],
      dark: ["#facc15"],
    },
  },
  Analytics: {
    label: "Analytics",
    colors: {
      light: ["#06b6d4"],
      dark: ["#22d3ee"],
    },
  },
  MLPipeline: {
    label: "ML Pipeline",
    colors: {
      light: ["#ec4899"],
      dark: ["#f472b6"],
    },
  },
  Dashboard: {
    label: "Dashboard",
    colors: {
      light: ["#22c55e"],
      dark: ["#4ade80"],
    },
  },
  Archive: {
    label: "Archive",
    colors: {
      light: ["#be185d"],
      dark: ["#ec4899"],
    },
  },
} satisfies ChartConfig;

export default function EChartsExampleSankeyChart() {
  return (
    <div className="w-full h-screen">
      <EChartsSankeyChart
        className="h-full w-full p-4"
        data={data}
        config={chartConfig}
      >
        <EChartsSankeyChart.Node isClickable />
        <EChartsSankeyChart.Link variant="source" />
        <EChartsSankeyChart.Tooltip />
      </EChartsSankeyChart>
    </div>
  );
}
Dependencies
More by Legion Dev
View all
CPU Architecture
1.9K
Database With REST API
1.2K
Radar Chart
352
Pie Chart
222
Line Chart
127
Area Chart
110
Bar Chart
98
LegionWebDev
86