About
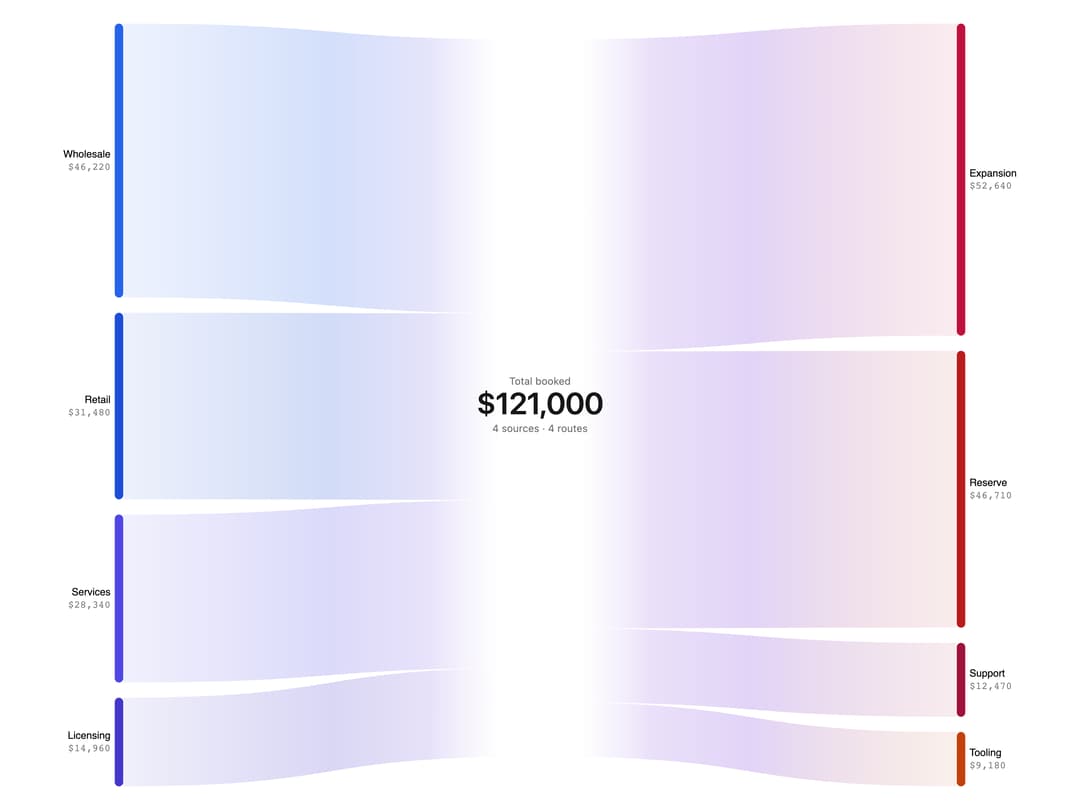
A sankey diagram showing revenue sources converging through a central hub and fanning back out to spending categories, with a total figure overlaid in the middle.
Built with React and Tailwind. Copy the prompt and paste it into Claude Code, Cursor or Lovable: your agent adds Pipeline Sankey Chart to your project and fits it to your theme.
Code
How Pipeline Sankey Chart is used: the demo's code. The component's own source comes with a free account.
Usage.tsx
import EChartsPipelineSankeyChart from "@/components/ui/pipeline-echarts-sankey-chart";

export default function Demo() {
  return (
    <div className="h-screen w-full bg-background text-foreground">
      <EChartsPipelineSankeyChart />
    </div>
  );
}
More by Legion Dev
View all
CPU Architecture
1.9K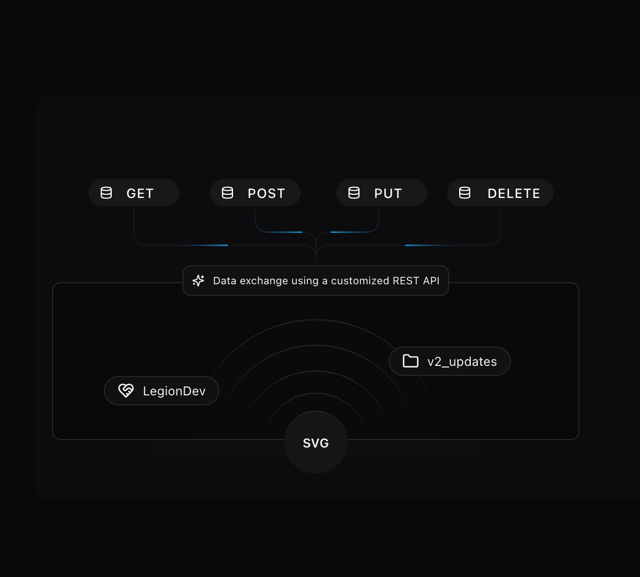
Database With REST API
1.2K
Radar Chart
352
Pie Chart
222
Line Chart
127
Area Chart
110
Bar Chart
98
LegionWebDev
86