
About
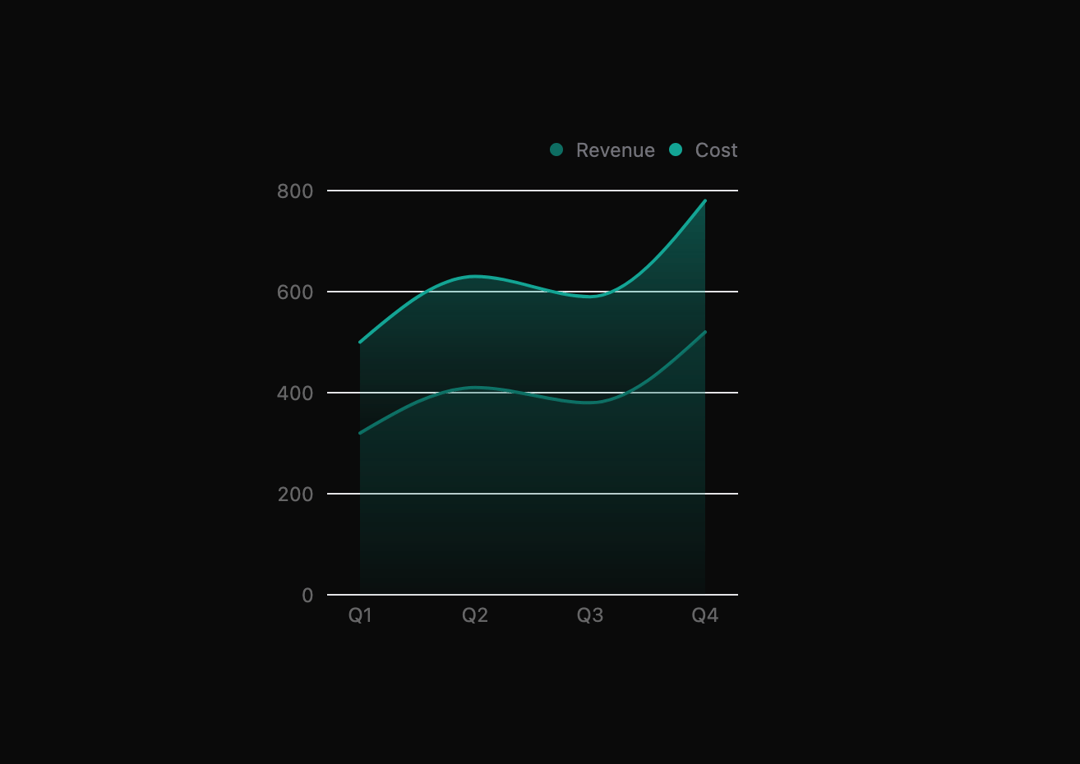
Here is Area Chart component
Built with React and Tailwind. Copy the prompt and paste it into Claude Code, Cursor or Lovable: your agent adds Area Chart to your project and fits it to your theme.
Code
How Area Chart is used: the demo's code. The component's own source comes with a free account.
Usage.tsx
import Component from "@/components/ui/area-chart";

export default function DemoOne() {
  return (
    <div className="flex flex-col gap-6 p-4">

      {/* example 2: custom data + labels + light theme */}
      <Component
        dark={false}
        stacked
        index="Quarter"
        categories={["Revenue", "Cost"]}
        data={[
          { Quarter: "Q1", Revenue: 320, Cost: 180 },
          { Quarter: "Q2", Revenue: 410, Cost: 220 },
          { Quarter: "Q3", Revenue: 380, Cost: 210 },
          { Quarter: "Q4", Revenue: 520, Cost: 260 },
        ]}
        className="max-w-3xl"
      />
    </div>
  );
}
Dependencies
More by SubframeApp
View all

Checkbox
16
Checkbox Card
14
Breadcrumb
12
Calendar
6
Context Menu
4
Checkbox Group
3
Accordion
3
Avatar
2