
About
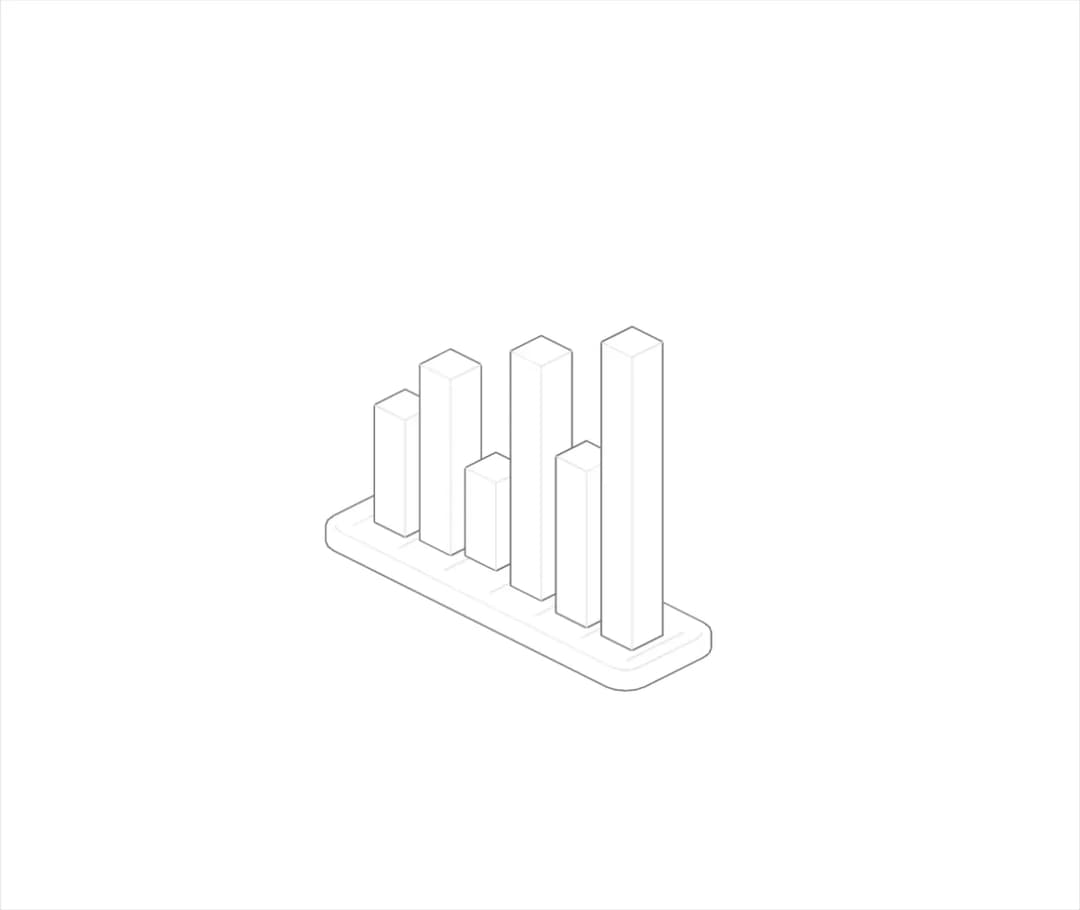
An interactive isometric bar chart that animates values on springs and lifts the bar under the pointer while showing its value in a caption.
Built with React and Tailwind. Copy the prompt and paste it into Claude Code, Cursor or Lovable: your agent adds Isometric Bars Chart to your project and fits it to your theme.
Code
How Isometric Bars Chart is used: the demo's code. The component's own source comes with a free account.
Usage.tsx
import { Bars } from "@/components/ui/bars";

export default function BarsDemo() {
  return (
    <div className="flex w-full items-center justify-center p-10 bg-background text-foreground">
      <div className="w-full max-w-md">
        <Bars
          data={[12, 18, 9, 24, 16, 30]}
          labels={["Jan", "Feb", "Mar", "Apr", "May", "Jun"]}
          onRead={(text) => console.log(text)}
        />
      </div>
    </div>
  );
}
More by abhishek-mallick
View all
Keys
8
Rack
6
Isometric Laptop
5
Nodes
5
Stack
5
Isometric Cube
5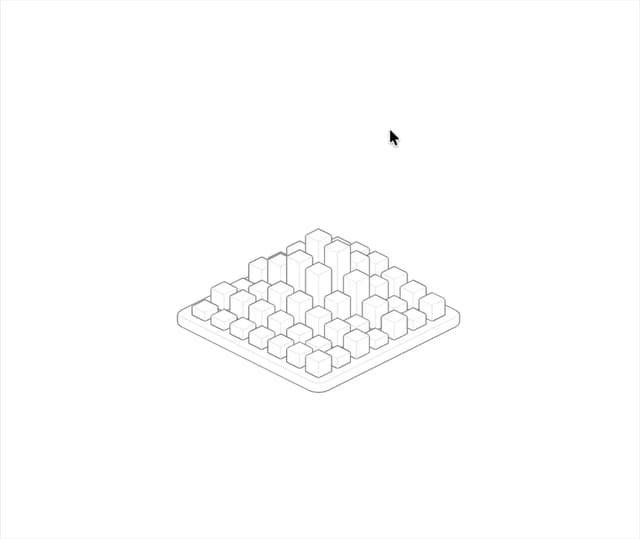
Skyline
4
PC Case
3