About
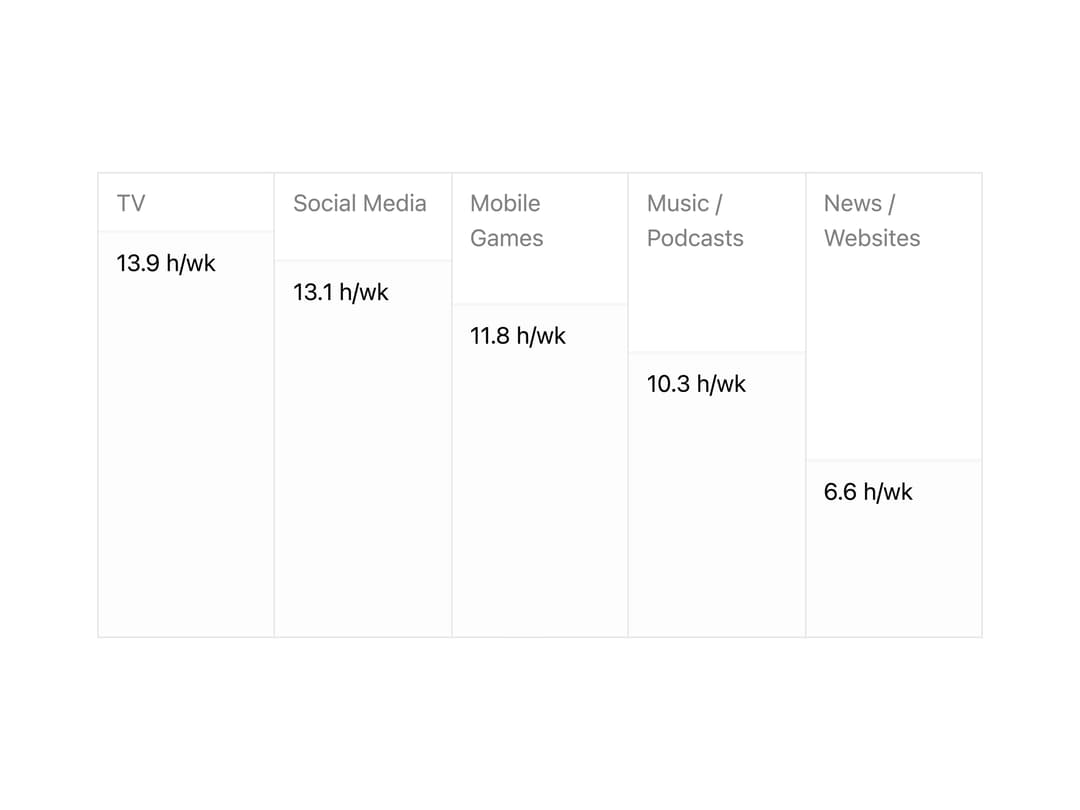
An animated bar chart that springs each column up from zero once it scrolls into view, with per-column labels, value formatting, and staggered delays.
Built with React and Tailwind. Copy the prompt and paste it into Claude Code, Cursor or Lovable: your agent adds Animated Chart to your project and fits it to your theme.
Code
How Animated Chart is used: the demo's code. The component's own source comes with a free account.
Usage.tsx
import { AnimatedChart } from "@/components/ui/animated-chart";

export default function AnimatedChartDemo() {
  return (
    <div className="w-full max-w-2xl p-8">
      <AnimatedChart
        columns={[
          { title: "TV", value: 13.9, appendString: "h/wk", animationDelay: 0 },
          {
            title: "Social Media",
            value: 13.1,
            appendString: "h/wk",
            animationDelay: 0.1,
          },
          {
            title: "Mobile Games",
            value: 11.8,
            appendString: "h/wk",
            animationDelay: 0.2,
          },
          {
            title: "Music / Podcasts",
            value: 10.3,
            appendString: "h/wk",
            animationDelay: 0.3,
          },
          {
            title: "News / Websites",
            value: 6.6,
            appendString: "h/wk",
            animationDelay: 0.4,
          },
        ]}
        maxValue={15}
        className="h-80"
      />
    </div>
  );
}
Dependencies
More by abui
View all
Scroll Reveal Content A
318
Timeline
106