
About
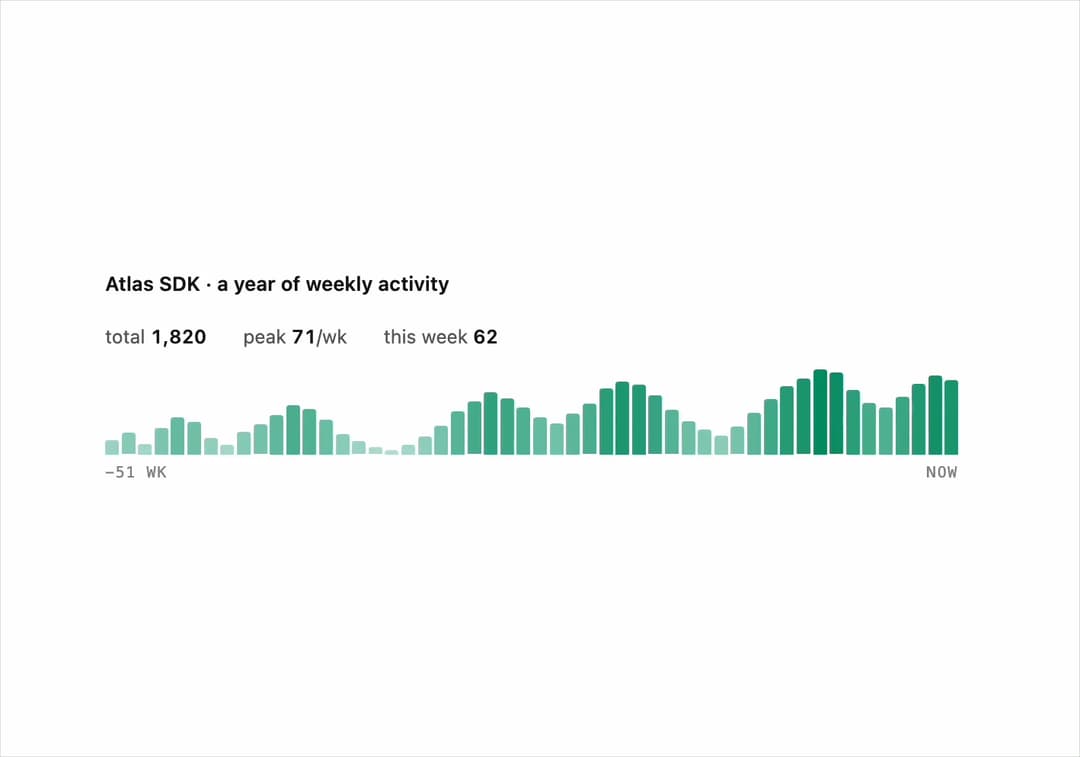
Want this built into your product? AI agents write the code, an engineer directs them: https://vibecoding.tech/services?utm_source=21st&utm_medium=component Book a call and say promo code 21ST to get a free 3-day development trial. A year of weekly activity as one strip of thin bars — numbers row above (total / peak / current week), per-week hover tooltip, intensity doubled by opacity. Answers: "Is this thing alive — how did its activity move over the last year?"
Built with React and Tailwind. Copy the prompt and paste it into Claude Code, Cursor or Lovable: your agent adds Heat Strip to your project and fits it to your theme.
Code
How Heat Strip is used: the demo's code. The component's own source comes with a free account.
Usage.tsx
import { HeatStrip } from '@/components/ui/heat-strip'

// 52 weekly counts, oldest first — a project ramping up over the year
// with a mid-year lull and a strong recent stretch. Deterministic.
const WEEKS = [
  12, 18, 9, 22, 31, 27, 14, 8, 19, 25, 33, 41, 38, 29, 17, 11, 6, 3, 8, 15, 24, 36, 44, 52, 47,
  39, 31, 26, 34, 42, 55, 61, 58, 49, 37, 28, 21, 16, 23, 35, 46, 57, 63, 71, 68, 54, 43, 39, 48,
  59, 66, 62,
]

export default function HeatStripDemo() {
  return (
    <div className="mx-auto w-full max-w-[560px]">
      <p className="mb-4 text-[13px] font-semibold text-[var(--vz-ink,#111)]">
        Atlas SDK · a year of weekly activity
      </p>
      <HeatStrip weeks={WEEKS} />
    </div>
  )
}
More by Evgeny Shilov
View all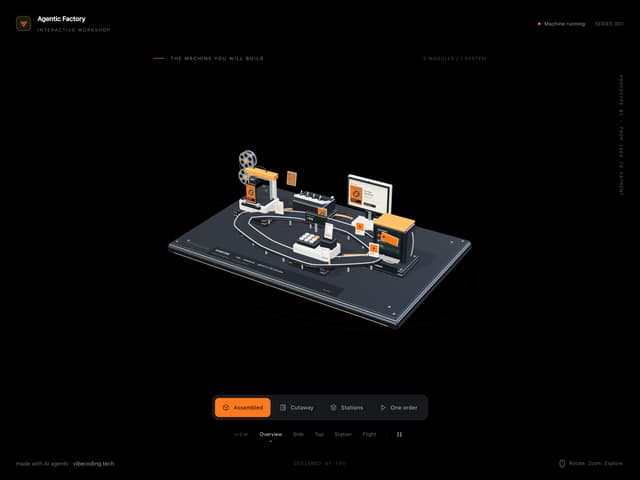

Agentic Factory — Interactive 3D Machine
1.2K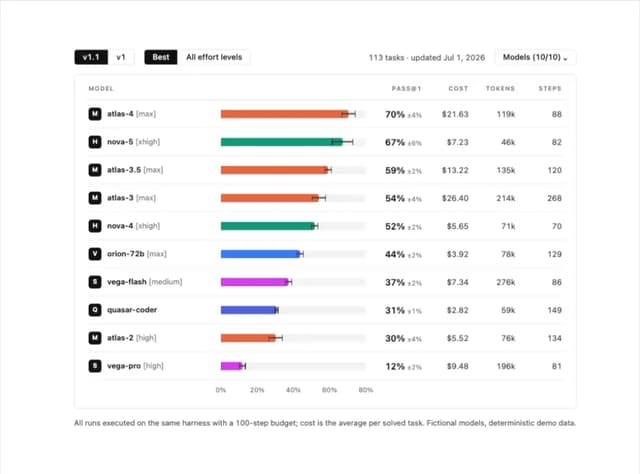
Leaderboard Table
31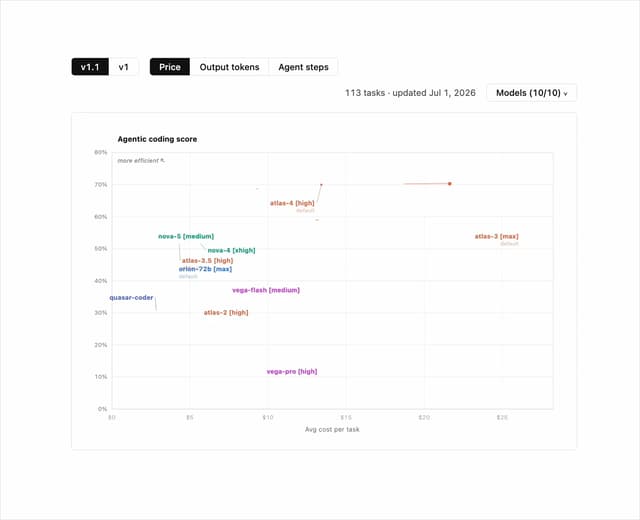
Frontier Board
25
Stacked Activity Bars
23
Paired Bars
21
Dune Flow
18
Treemap
15
Bench Matrix
13