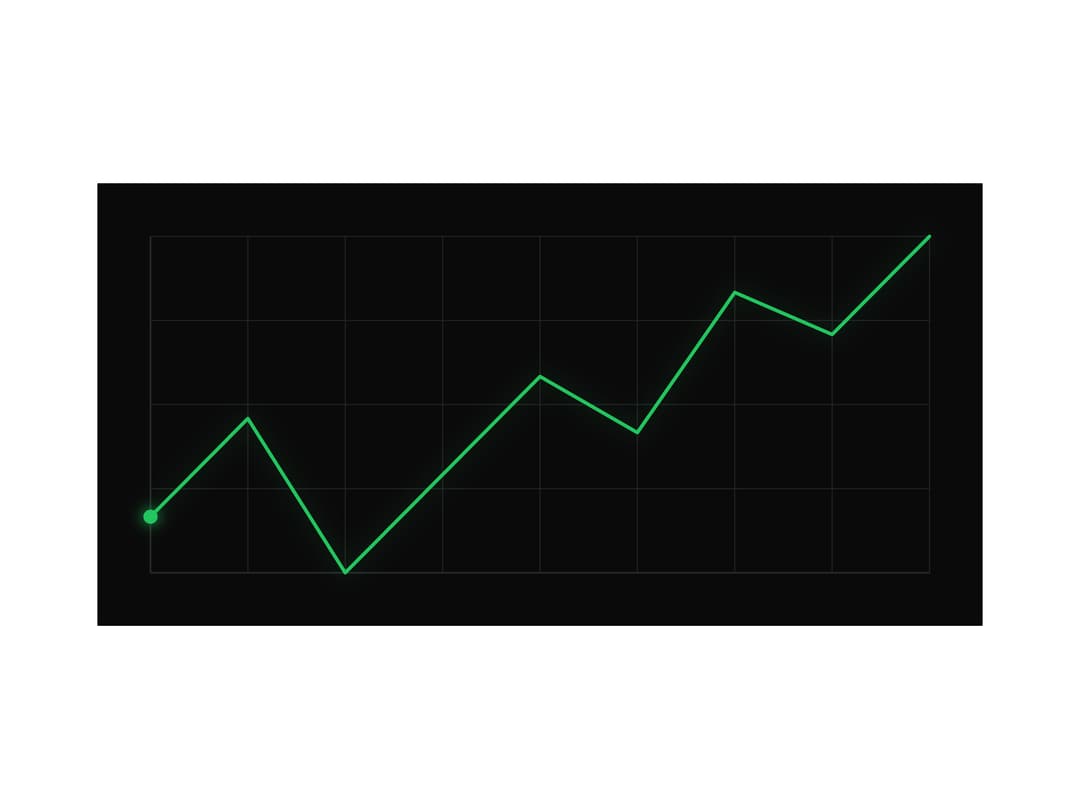
About
An SVG line chart whose path animates on with a stroke-dashoffset draw effect and a glowing leading dot, for showcasing data trends in product/marketing videos or UI demos.
Built with React and Tailwind. Copy the prompt and paste it into Claude Code, Cursor or Lovable: your agent adds Animated Line Chart to your project and fits it to your theme.
Code
How Animated Line Chart is used: the demo's code. The component's own source comes with a free account.
Usage.tsx
import AnimatedLineChart from "@/components/ui/animated-line-chart";

export default function AnimatedLineChartDemo() {
  return (
    <div className="w-full h-screen flex items-center justify-center bg-background">
      <AnimatedLineChart />
    </div>
  );
}
Dependencies
More by framecn
View all
Blur Out Up
33
Shader Dithering
30
Zoom Through Transition
19
Top Down Letters
19
Strikethrough Replace
17
Format Morph
14
Mesh Gradient Background
11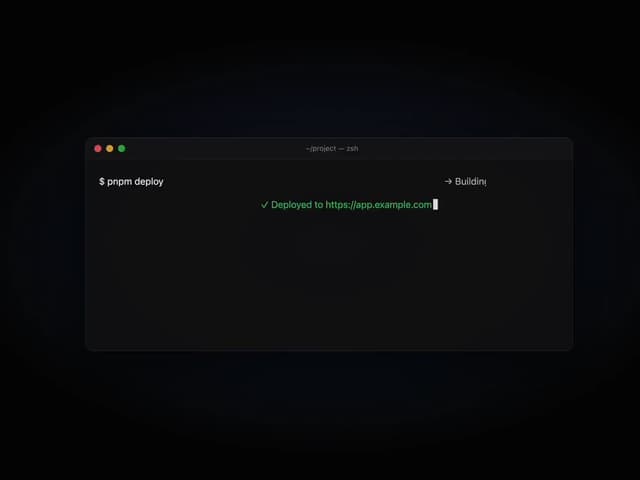
Terminal to Browser Deploy
9