
About
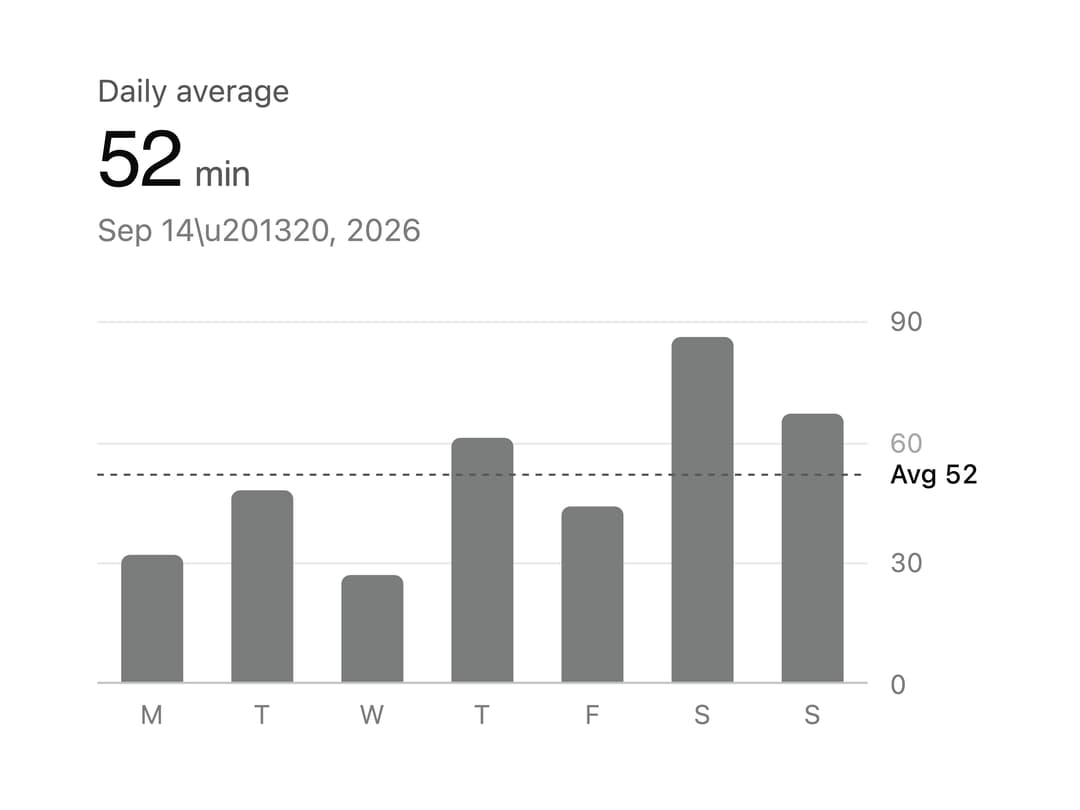
An animated bar chart that compares one measure across a run of days, weeks, or months and lets you scrub any bar with the pointer or arrow keys to read its exact value.
Built with React and Tailwind. Copy the prompt and paste it into Claude Code, Cursor or Lovable: your agent adds Bar Chart to your project and fits it to your theme.
Code
How Bar Chart is used: the demo's code. The component's own source comes with a free account.
Usage.tsx
"use client";

import BarChart from "@/components/ui/bar-chart";

const week = [
  { key: "2026-09-14", label: "Mon, Sep 14", axisLabel: "M", value: 32 },
  { key: "2026-09-15", label: "Tue, Sep 15", axisLabel: "T", value: 48 },
  { key: "2026-09-16", label: "Wed, Sep 16", axisLabel: "W", value: 27 },
  { key: "2026-09-17", label: "Thu, Sep 17", axisLabel: "T", value: 61 },
  { key: "2026-09-18", label: "Fri, Sep 18", axisLabel: "F", value: 44 },
  { key: "2026-09-19", label: "Sat, Sep 19", axisLabel: "S", value: 86 },
  { key: "2026-09-20", label: "Sun, Sep 20", axisLabel: "S", value: 67 },
];

export default function BarChartDemo() {
  return (
    <div className="w-full max-w-md p-6">
      <BarChart
        data={week}
        label="Active minutes"
        period="Sep 14\u201320, 2026"
        unit="min"
      />
    </div>
  );
}
Dependencies
More by kuratlielia
View all
Activity Heatmap
362
Image Compare
107
User Menu
94
Date Range Picker
63
Stats Band
55
Usage Meter
46
Signature Pad
37
Timeline
34