
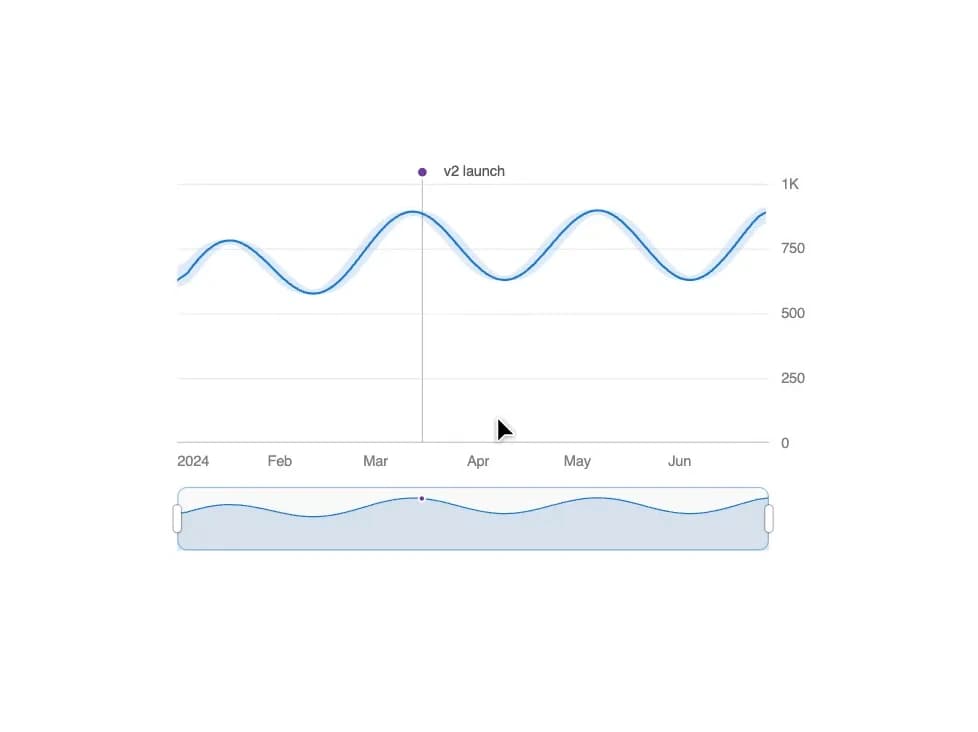
About
A time-series chart with a zoomable overview strip beneath it—drag to draw a window, resize it by its handles, and read values and event markers in place.
Built with React and Tailwind. Copy the prompt and paste it into Claude Code, Cursor or Lovable: your agent adds Brush Chart to your project and fits it to your theme.
Code
How Brush Chart is used: the demo's code. The component's own source comes with a free account.
Usage.tsx
"use client";

import BrushChart from "@/components/ui/brush-chart";

const data = Array.from({ length: 180 }, (_, i) => ({
  date: Date.UTC(2024, 0, 1) + i * 86_400_000,
  value: Math.round(
    600 + Math.sin(i / 9) * 140 + Math.sin(i / 37) * 60 + i * 1.4,
  ),
}));

export default function BrushChartDemo() {
  return (
    <div className="w-full max-w-xl mx-auto p-6">
      <BrushChart
        data={data}
        label="Daily active users"
        unit="users"
        annotations={[{ date: Date.UTC(2024, 2, 15), label: "v2 launch" }]}
      />
    </div>
  );
}
Dependencies
More by kuratlielia
View all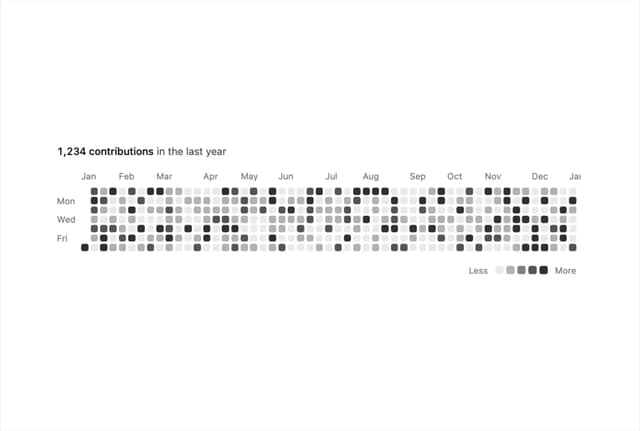
Activity Heatmap
361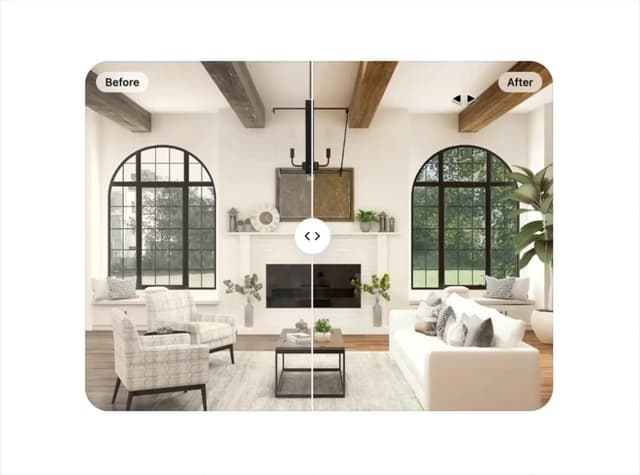
Image Compare
107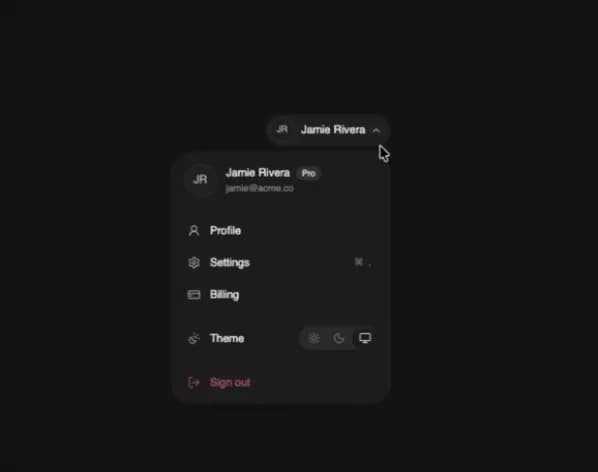
User Menu
94
Date Range Picker
63
Stats Band
53
Usage Meter
46
Signature Pad
37
Timeline
34