
About
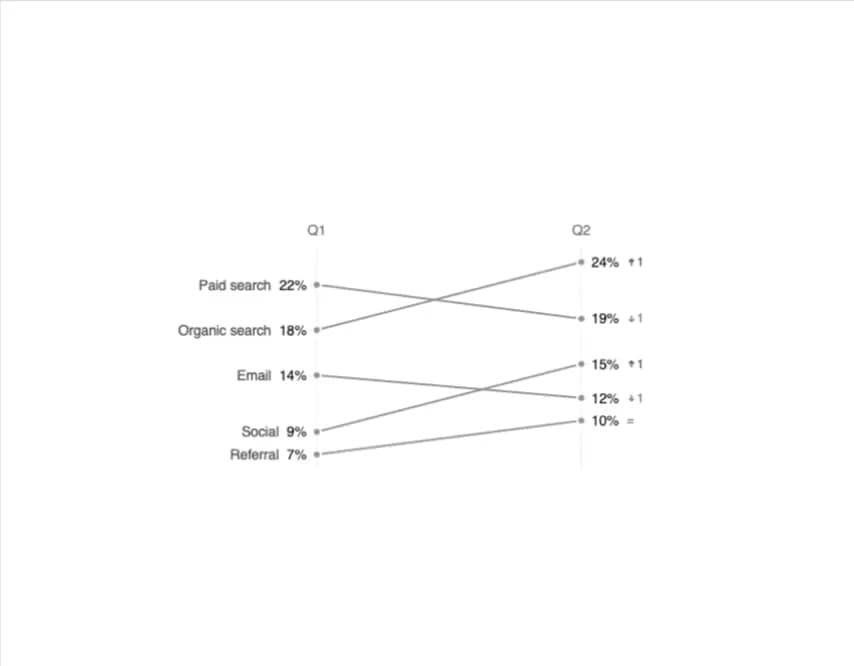
An animated chart that plots how a set of items changed between two time periods, connecting each item's two values with a line and showing rank movement beside each value.
Built with React and Tailwind. Copy the prompt and paste it into Claude Code, Cursor or Lovable: your agent adds Slope Chart to your project and fits it to your theme.
Code
How Slope Chart is used: the demo's code. The component's own source comes with a free account.
Usage.tsx
"use client";

import SlopeChart from "@/components/ui/slope-chart";

export default function SlopeChartDemo() {
  return (
    <div className="w-full max-w-xl p-6">
      <SlopeChart
        label="Conversion rate by channel"
        startLabel="Q1"
        endLabel="Q2"
        formatValue={(value) => `${value}%`}
        data={[
          { key: "organic", label: "Organic search", start: 18, end: 24 },
          { key: "paid", label: "Paid search", start: 22, end: 19 },
          { key: "social", label: "Social", start: 9, end: 15 },
          { key: "email", label: "Email", start: 14, end: 12 },
          { key: "referral", label: "Referral", start: 7, end: 10 },
        ]}
      />
    </div>
  );
}
Dependencies
More by kuratlielia
View all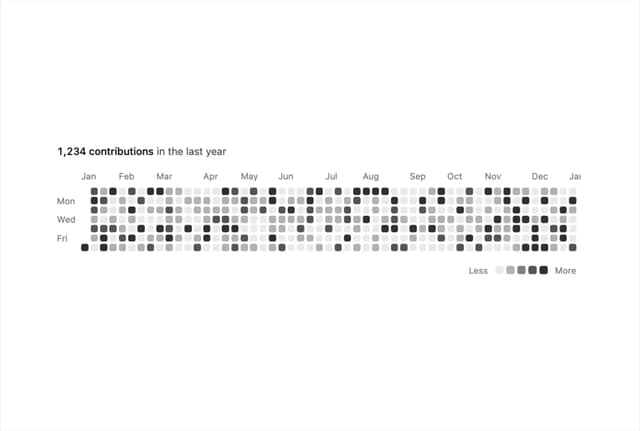
Activity Heatmap
340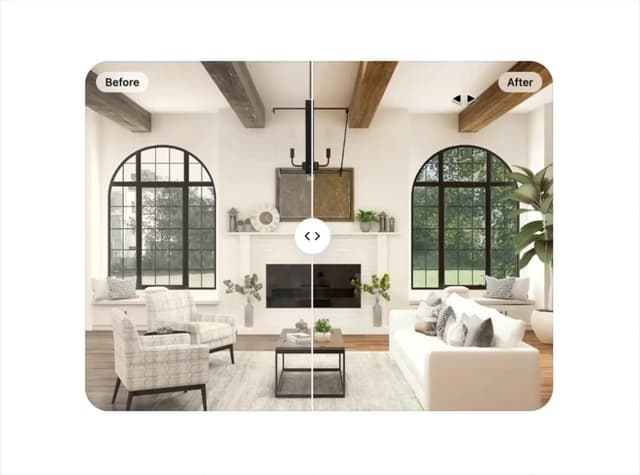
Image Compare
104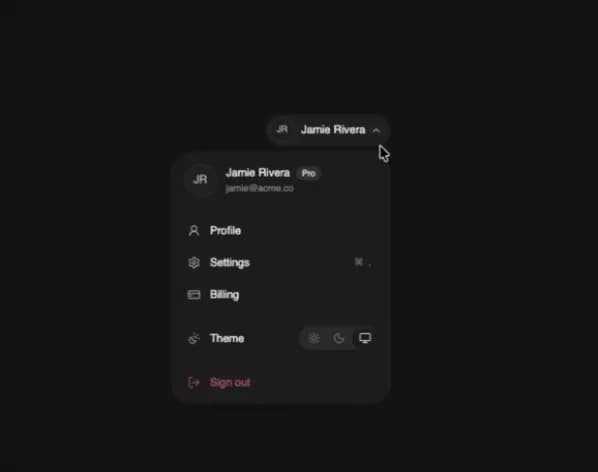
User Menu
93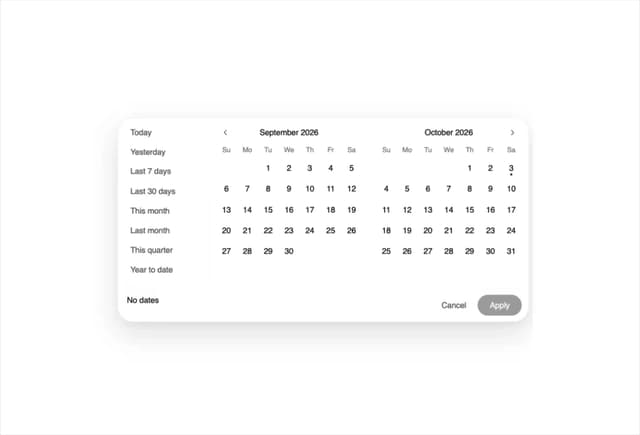
Date Range Picker
62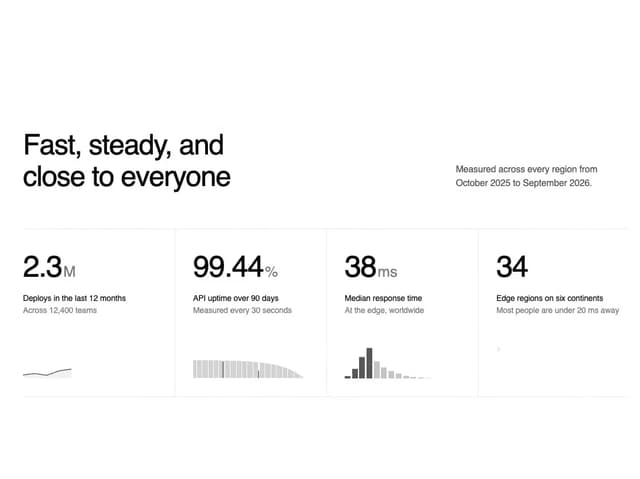
Stats Band
52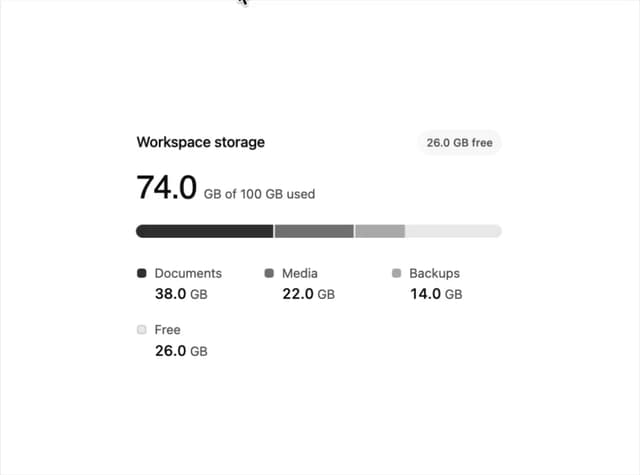
Usage Meter
45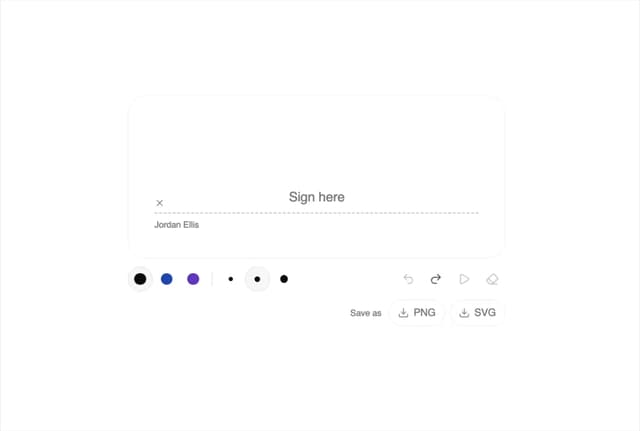
Signature Pad
37
Timeline
33