
About
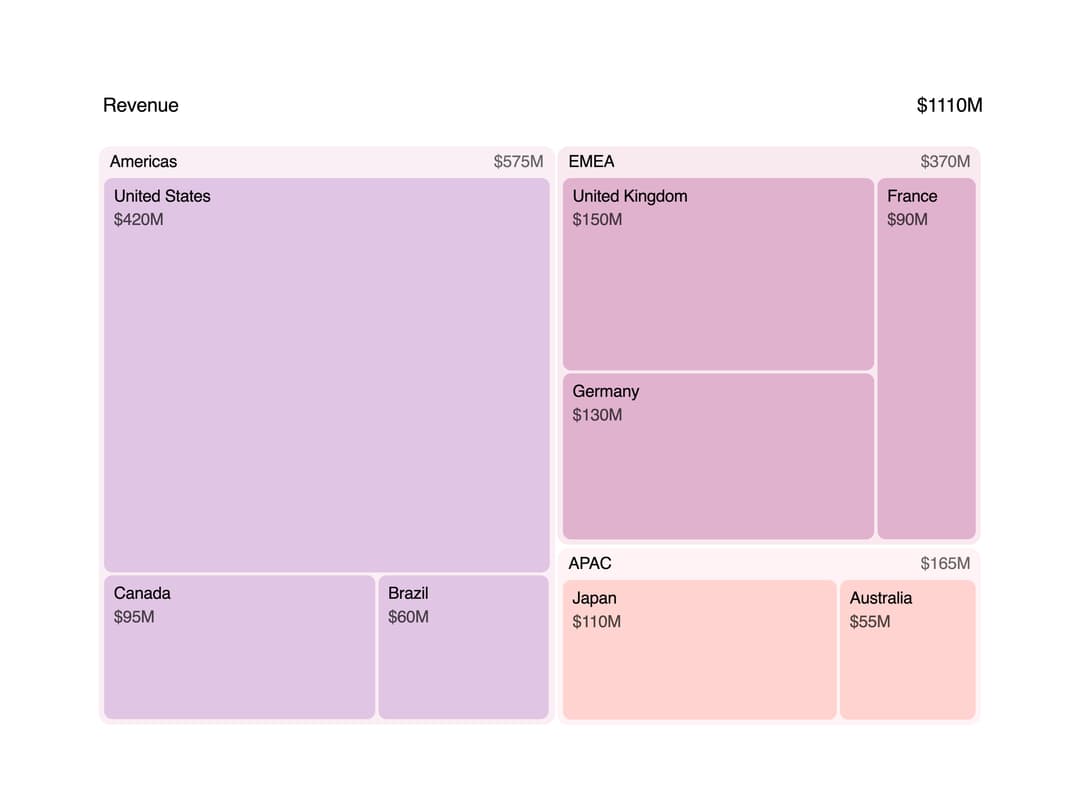
A squarified treemap chart for showing a hierarchy of parts by size, like revenue by region and country, where you click a tile to drill in and the tiles animate to fill the view.
Built with React and Tailwind. Copy the prompt and paste it into Claude Code, Cursor or Lovable: your agent adds Treemap to your project and fits it to your theme.
Code
How Treemap is used: the demo's code. The component's own source comes with a free account.
Usage.tsx
"use client";

import Treemap from "@/components/ui/treemap";

const data = {
  id: "root",
  label: "Revenue",
  children: [
    {
      id: "americas",
      label: "Americas",
      children: [
        { id: "us", label: "United States", value: 420 },
        { id: "ca", label: "Canada", value: 95 },
        { id: "br", label: "Brazil", value: 60 },
      ],
    },
    {
      id: "emea",
      label: "EMEA",
      children: [
        { id: "uk", label: "United Kingdom", value: 150 },
        { id: "de", label: "Germany", value: 130 },
        { id: "fr", label: "France", value: 90 },
      ],
    },
    {
      id: "apac",
      label: "APAC",
      children: [
        { id: "jp", label: "Japan", value: 110 },
        { id: "au", label: "Australia", value: 55 },
      ],
    },
  ],
};

export default function TreemapDemo() {
  return (
    <div className="w-full max-w-2xl p-4">
      <Treemap data={data} label="Revenue" formatValue={(v) => `$${v}M`} />
    </div>
  );
}
Dependencies
More by kuratlielia
View all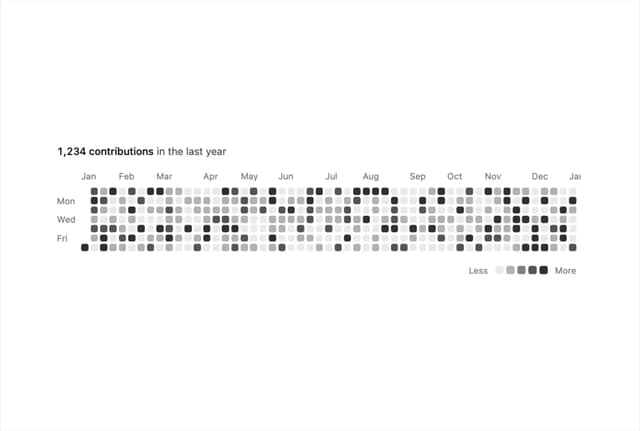
Activity Heatmap
341
Image Compare
104
User Menu
93
Date Range Picker
62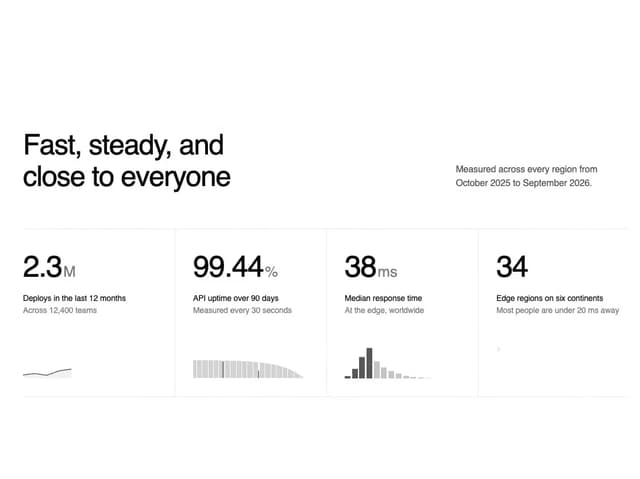
Stats Band
52
Usage Meter
45
Signature Pad
37
Timeline
33