
About
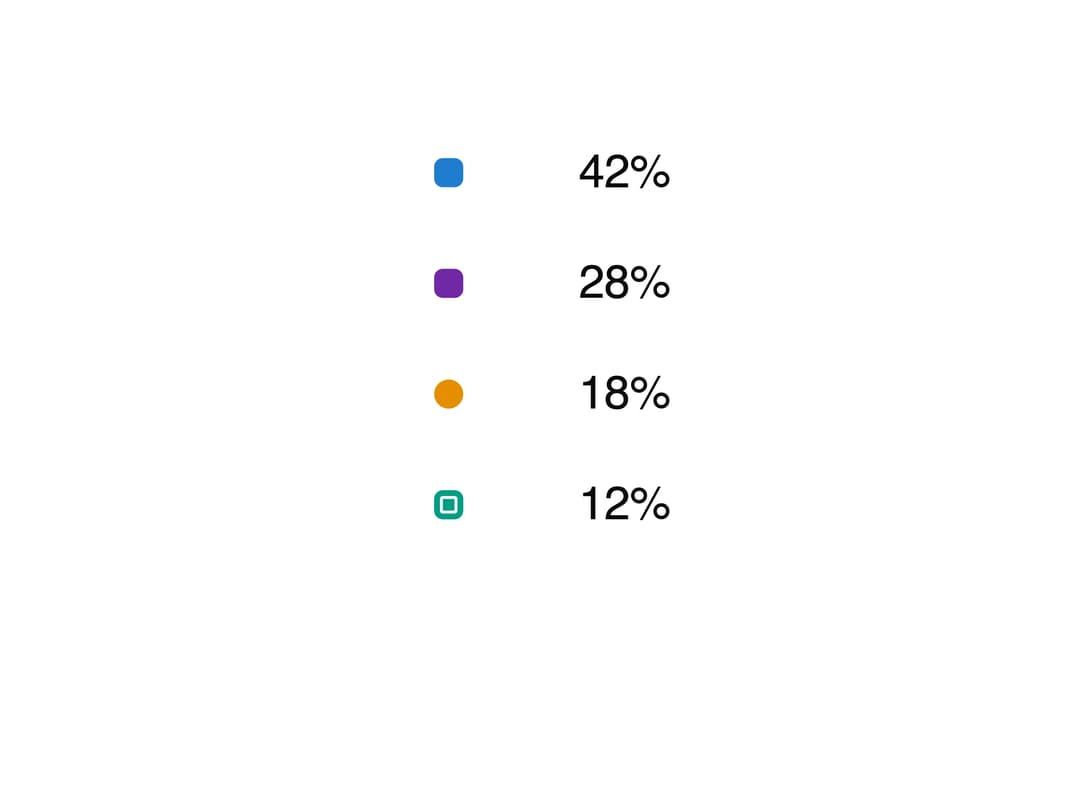
A ten-by-ten unit chart where every cell represents one percent of a total, animating cells flying to their new category when the underlying data changes.
Built with React and Tailwind. Copy the prompt and paste it into Claude Code, Cursor or Lovable: your agent adds Waffle Chart to your project and fits it to your theme.
Code
How Waffle Chart is used: the demo's code. The component's own source comes with a free account.
Usage.tsx
"use client";

import WaffleChart from "@/components/ui/waffle-chart";

export default function WaffleChartDemo() {
  return (
    <div className="flex w-full max-w-md items-center justify-center p-8">
      <WaffleChart
        label="Electricity generation, 2023"
        unit="TWh"
        data={[
          { key: "solar", label: "Solar", value: 42 },
          { key: "wind", label: "Wind and offshore", value: 28 },
          { key: "hydro", label: "Hydro", value: 18 },
          { key: "other", label: "Other renewables", value: 12 },
        ]}
      />
    </div>
  );
}
Dependencies
More by kuratlielia
View all
Activity Heatmap
339
Image Compare
104
User Menu
93
Date Range Picker
62
Stats Band
52
Usage Meter
45
Signature Pad
37
Timeline
33