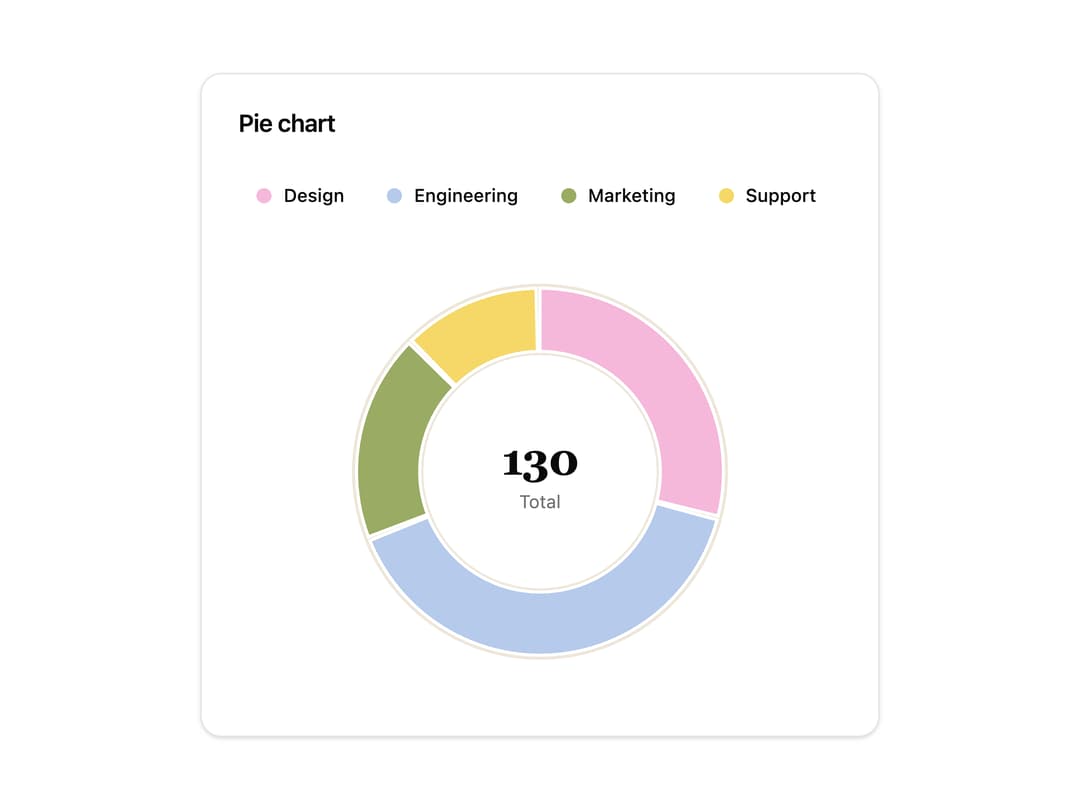
About
An interactive pie or donut chart that shows how parts add up to a whole, with a hoverable/keyboard-inspectable legend and an accessible data table.
Built with React and Tailwind. Copy the prompt and paste it into Claude Code, Cursor or Lovable: your agent adds Pie Chart to your project and fits it to your theme.
Code
How Pie Chart is used: the demo's code. The component's own source comes with a free account.
Usage.tsx
import { PieChart } from "@/components/ui/pie-chart";

const data = [
  { label: "Design", value: 38, color: "pink" as const },
  { label: "Engineering", value: 52, color: "blue" as const },
  { label: "Marketing", value: 24, color: "olive" as const },
  { label: "Support", value: 16, color: "yellow" as const },
];

export default function PieChartDemo() {
  return (
    <div className="flex w-full items-center justify-center p-6">
      <PieChart data={data} variant="donut" className="w-full max-w-md" />
    </div>
  );
}
More by luv-jeri
View all

Pixel Swap
26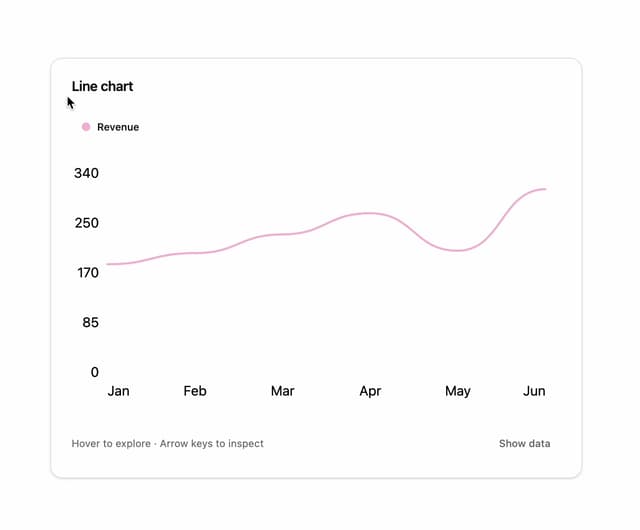
Line Chart
9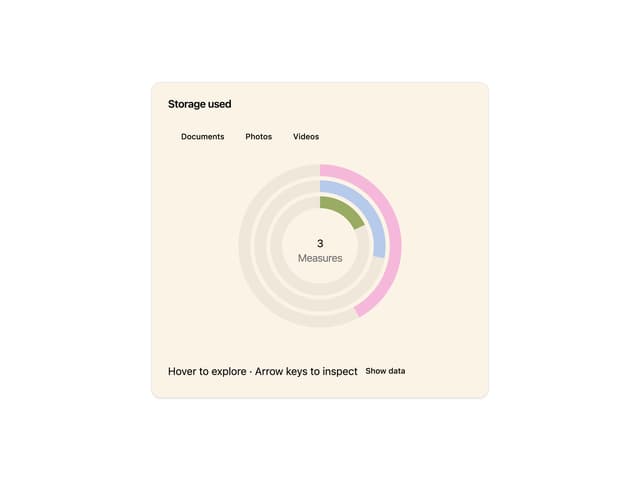
Radial Chart
Infinite Spiral Gallery

Dither Sculpture