
About
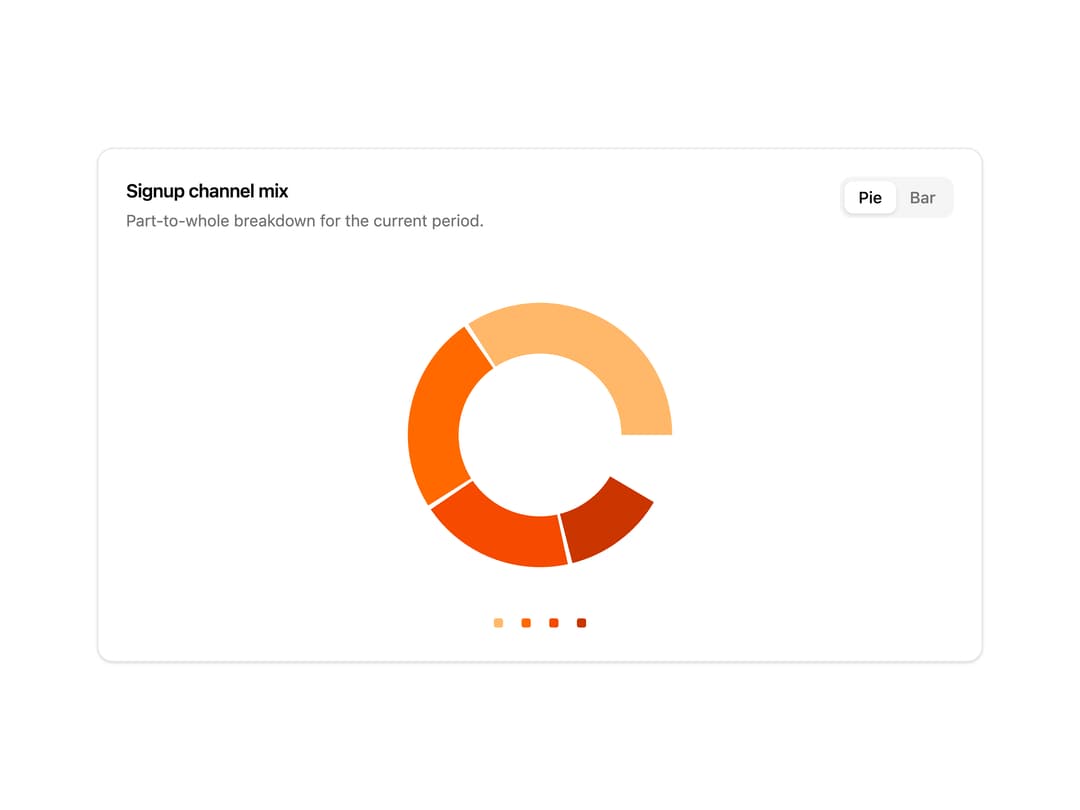
A card that renders line, bar, or pie charts from a static data array, with automatic key detection, per-series colors, number/currency/percent formatting, and built-in loading, empty, and error states.
Built with React and Tailwind. Copy the prompt and paste it into Claude Code, Cursor or Lovable: your agent adds Charts to your project and fits it to your theme.
Code
How Charts is used: the demo's code. The component's own source comes with a free account.
Usage.tsx
"use client";

import { Charts } from "@/components/ui/charts";

const data = [
  { channel: "Direct", value: 38 },
  { channel: "Referral", value: 27 },
  { channel: "Organic", value: 21 },
  { channel: "Paid", value: 14 },
];

export default function ChannelMixPieChart() {
  return (
    <Charts
      title="Signup channel mix"
      description="Part-to-whole breakdown for the current period."
      data={data}
      categoryKey="channel"
      valueKey="value"
      availableChartTypes={["pie", "bar"]}
      defaultChartType="pie"
      format={{ value: "percent" }}
    />
  );
}
Dependencies
More by Ahmed Shobky
View all
Text Editor Card
5