
About
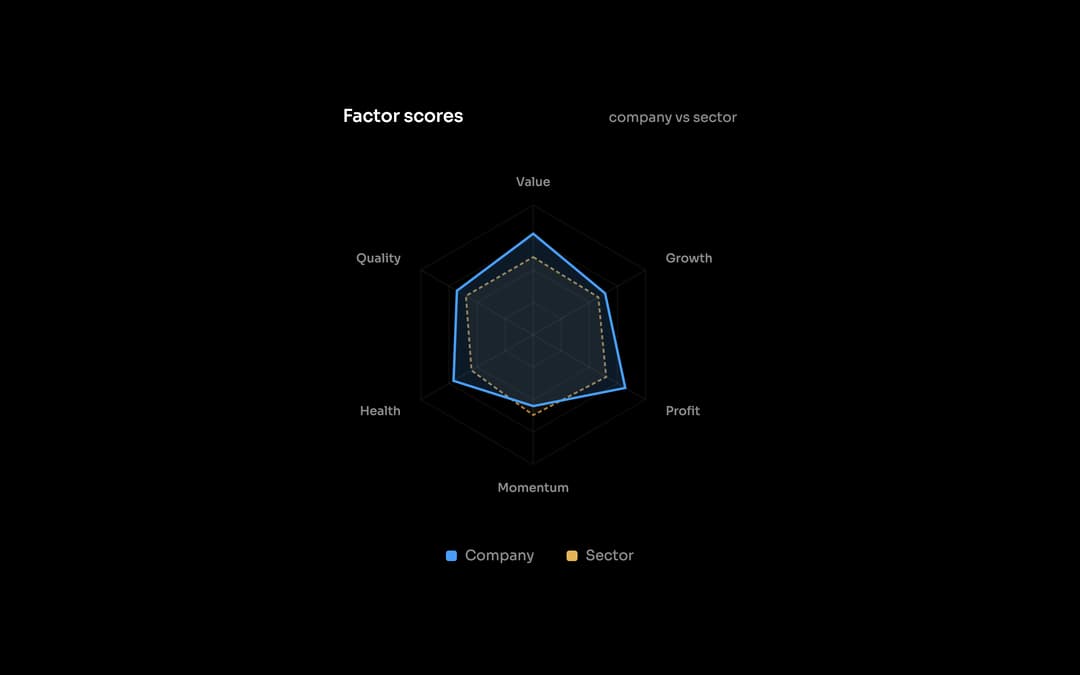
A factor score radar chart for equity research, comparing a company with its sector on value, growth, profit, momentum and quality. Part of ssych ui: https://ssych.com/library/analyst-radar
Built with React and Tailwind. Copy the prompt and paste it into Claude Code, Cursor or Lovable: your agent adds Analyst Radar to your project and fits it to your theme.
Code
How Analyst Radar is used: the demo's code. The component's own source comes with a free account.
Usage.tsx
import { useEffect } from "react"
import AnalystRadar from "@/components/ui/analyst-radar"

export default function DemoOne() {
  // open the preview in dark by default; the sandbox theme toggle still works
  useEffect(() => { document.documentElement.classList.add("dark") }, [])
  return (
    <div className="flex min-h-[340px] w-full items-center justify-center p-6">
      <AnalystRadar
        title="Factor scores"
        caption="company vs sector"
        axes={["Value", "Growth", "Profit", "Momentum", "Health", "Quality"]}
        primary={[78, 64, 82, 55, 71, 68]}
        secondary={[60, 58, 65, 62, 55, 60]}
        primaryLabel="Company"
        secondaryLabel="Sector"
      />
    </div>
  )
}
Dependencies
More by Savva Sicevs
View all

Price Target Fan
198
Candle Chart
179
Market Snapshot
125
Returns Calendar
98
Range Navigator
94
SMA Chart
93
Market Watchlist
93
Sectors Donut
68