
About
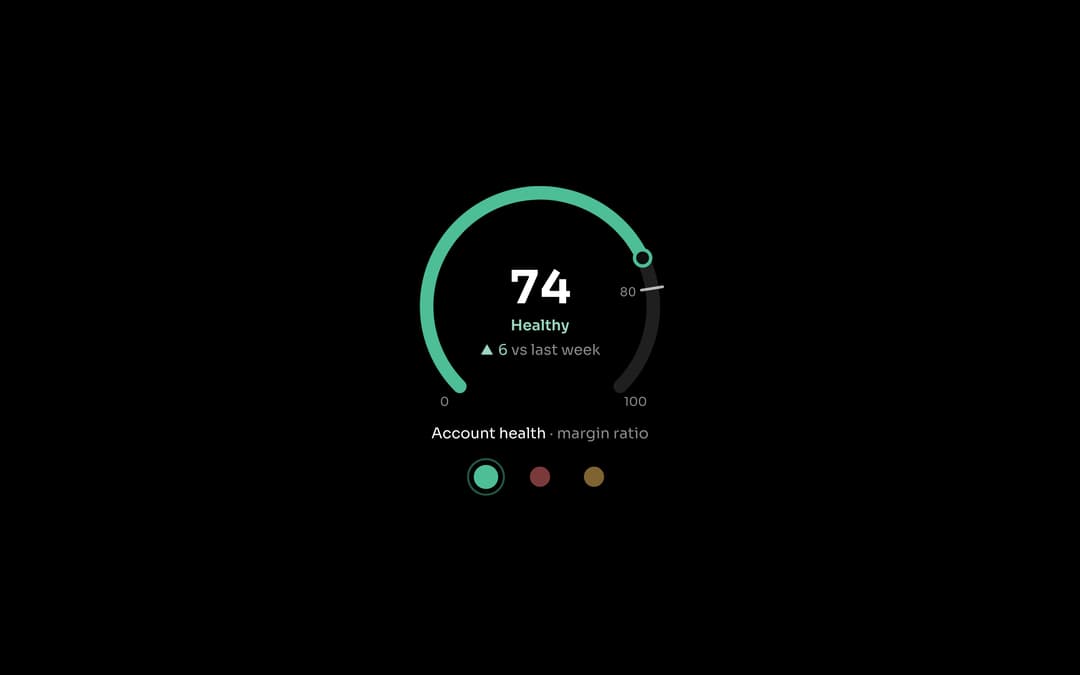
A gauge chart for margin ratio, fear and greed or liquidity scores, on a 270 degree dial that counts up and cycles metrics on click. Part of ssych ui: https://ssych.com/library/health-gauge
Built with React and Tailwind. Copy the prompt and paste it into Claude Code, Cursor or Lovable: your agent adds Health Gauge to your project and fits it to your theme.
Code
How Health Gauge is used: the demo's code. The component's own source comes with a free account.
Usage.tsx
import { useEffect } from "react"
import HealthGauge, { type HealthGaugeMetric } from "@/components/ui/health-gauge"

const METRICS: HealthGaugeMetric[] = [
  { value: 74, previous: 68, previousLabel: "vs last week", target: 80, label: "Account health", sub: "margin ratio" },
  { value: 38, previous: 45, previousLabel: "vs yesterday", label: "Fear & Greed", sub: "market sentiment" },
  { value: 61, previous: 61, previousLabel: "vs last hour", target: 70, label: "Liquidity", sub: "depth score" },
]

export default function DemoOne() {
  // open the preview in dark by default; the sandbox theme toggle still works
  useEffect(() => { document.documentElement.classList.add("dark") }, [])
  return (
    <div className="flex min-h-[320px] w-full items-center justify-center p-6">
      <HealthGauge metrics={METRICS} />
    </div>
  )
}
Dependencies
More by Savva Sicevs
View all

Price Target Fan
198
Candle Chart
179
Market Snapshot
125
Returns Calendar
98
Range Navigator
94
SMA Chart
93
Market Watchlist
93
Sectors Donut
68
More in Dashboards
View all
Dashboard with Collapsible Sidebar
2.4K

Sidebar
234

SaaS Template
2.4K
Stats Bento
1.1K

Financial Bento Grid
71
Stats cards with links
33

Course Design Cards
1.1K

Chat template
598


