
About
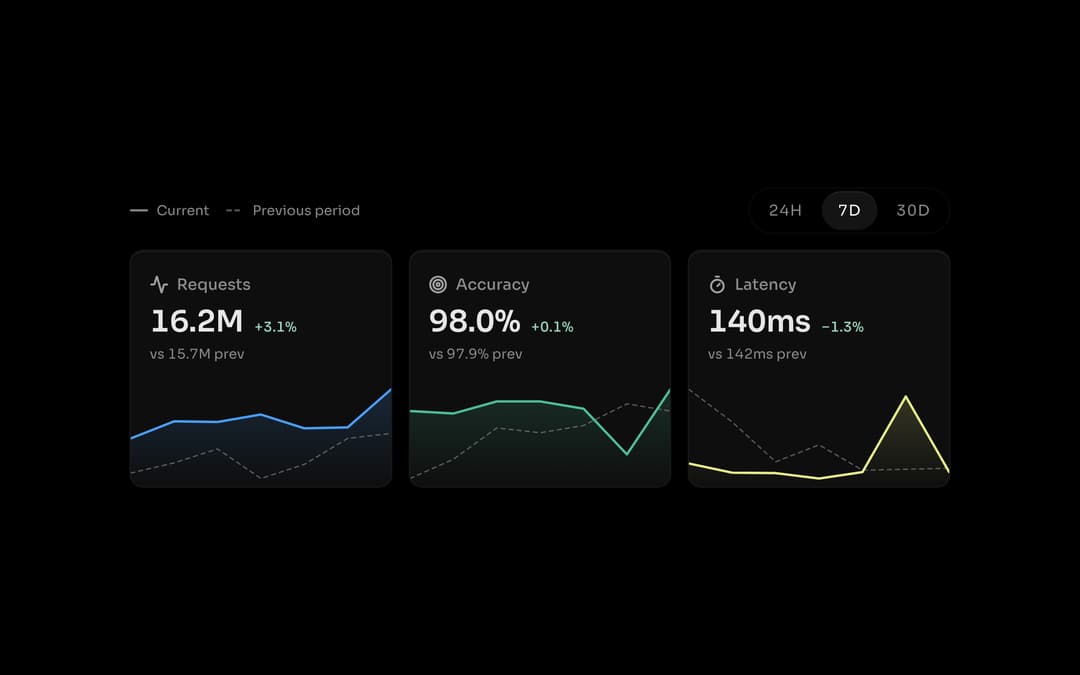
A KPI card row for SaaS, AI and API dashboards, with metrics like requests and uptime counting up over area charts you can scrub. Part of ssych ui: https://ssych.com/library/kpi-card-row
Built with React and Tailwind. Copy the prompt and paste it into Claude Code, Cursor or Lovable: your agent adds KPI Card Row to your project and fits it to your theme.
Code
How KPI Card Row is used: the demo's code. The component's own source comes with a free account.
Usage.tsx
import { useEffect } from "react"
import { Activity, Target, Timer } from "lucide-react"
import KpiCardRow from "@/components/ui/kpi-card-row"
import type { KpiMetric, KpiRange, KpiSeries } from "@/components/ui/kpi-card-row"

/* Sixty days of hourly telemetry for an inference API, generated once from a fixed seed
   (no Math.random), then rolled up per range: 24H = 24 hourly points, 7D = 7 daily points,
   30D = 30 daily points. Each range also carries the window before it. Latency is the hourly
   p95; an incident around day 40 lifts its 30-day mean. */

function seeded(seed: number) {
  return () => {
    seed = (seed + 0x6d2b79f5) | 0
    let t = Math.imul(seed ^ (seed >>> 15), 1 | seed)
    t = (t + Math.imul(t ^ (t >>> 7), 61 | t)) ^ t
    return ((t ^ (t >>> 14)) >>> 0) / 4294967296
  }
}

const HOURS = 60 * 24
const END = Date.UTC(2026, 8, 26, 12)
const rand = seeded(2126)
const bump = (day: number, at: number, width: number) => Math.exp(-(((day - at) / width) ** 2))

const time: number[] = []
const requests: number[] = []
const accuracy: number[] = []
const latency: number[] = []

for (let i = 0; i < HOURS; i++) {
  const t = END - (HOURS - 1 - i) * 36e5
  const day = i / 24
  const load = 0.5 - 0.5 * Math.cos(((new Date(t).getUTCHours() - 3) / 24) * 2 * Math.PI)
  const incident = bump(day, 40, 4.5)
  time.push(t)
  requests.push(Math.round(84000 * (0.7 + 0.45 * load) * (1 + 0.0042 * day) * (1 + (rand() - 0.5) * 0.14)))
  accuracy.push(Math.round((97.62 + 0.009 * day - 1.6 * incident - 0.35 * bump(day, 58.5, 0.45) - 0.25 * load + (rand() - 0.5) * 0.5) * 100) / 100)
  latency.push(Math.round(131 + 20 * load + 82 * incident + 15 * bump(day, 58.5, 0.45) - 0.1 * Math.max(0, day - 30) + (rand() - 0.5) * 16))
}

const WINDOWS = { "24h": [24, 1], "7d": [168, 24], "30d": [720, 24] } as const

function rollup(values: number[], size: number, how: "sum" | "avg") {
  const out: number[] = []
  for (let i = 0; i < values.length; i += size) {
    const chunk = values.slice(i, i + size)
    const sum = chunk.reduce((a, b) => a + b, 0)
    out.push(how === "sum" ? sum : Math.round((sum / chunk.length) * 100) / 100)
  }
  return out
}

function byRange(values: number[], how: "sum" | "avg") {
  const out: Record<string, KpiSeries> = {}
  for (const [key, [span, size]] of Object.entries(WINDOWS)) {
    out[key] = {
      current: rollup(values.slice(-span), size, how),
      previous: rollup(values.slice(-2 * span, -span), size, how),
      timestamps: time.slice(-span).filter((_, i) => i % size === 0),
    }
  }
  return out
}

const compact = new Intl.NumberFormat("en-US", { notation: "compact", maximumSignificantDigits: 3 })

const ranges: KpiRange[] = [
  { value: "24h", label: "24H" },
  { value: "7d", label: "7D" },
  { value: "30d", label: "30D" },
]

const metrics: KpiMetric[] = [
  {
    id: "requests",
    label: "Requests",
    icon: <Activity />,
    color: "var(--chart-1)",
    aggregate: "sum",
    format: (v) => compact.format(v),
    series: byRange(requests, "sum"),
  },
  {
    id: "accuracy",
    label: "Accuracy",
    icon: <Target />,
    color: "var(--chart-2)",
    aggregate: "avg",
    format: (v) => `${v.toFixed(1)}%`,
    series: byRange(accuracy, "avg"),
  },
  {
    id: "latency",
    label: "Latency",
    icon: <Timer />,
    color: "var(--chart-4)",
    aggregate: "avg",
    format: (v) => `${Math.round(v)}ms`,
    lowerIsBetter: true,
    series: byRange(latency, "avg"),
  },
]

export default function DemoOne() {
  // open the preview in dark by default; the sandbox theme toggle still works
  useEffect(() => { document.documentElement.classList.add("dark") }, [])
  return (
    <div className="mx-auto w-full max-w-2xl p-4">
      <KpiCardRow metrics={metrics} ranges={ranges} defaultRange="7d" />
    </div>
  )
}
Dependencies
More by Savva Sicevs
View all

Price Target Fan
198
Candle Chart
179
Market Snapshot
125
Returns Calendar
98
Range Navigator
94
SMA Chart
93
Market Watchlist
93
Sectors Donut
68
More in Dashboards
View all
Dashboard with Collapsible Sidebar
2.4K

Sidebar
234

SaaS Template
2.4K
Stats Bento
1.1K

Financial Bento Grid
71
Stats cards with links
33

Course Design Cards
1.1K

Chat template
598


