
About
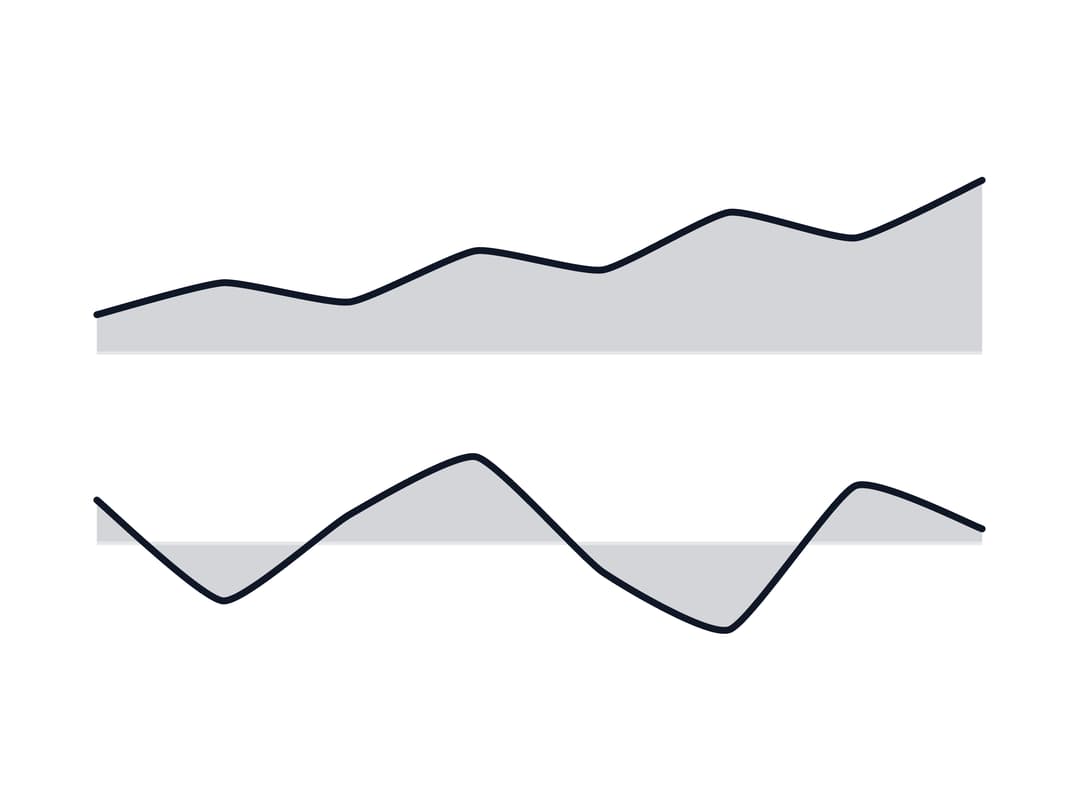
A compact inline chart (line, area, or column) that shows a data trend at a glance inside a KPI card, table row, or dashboard header, with an optional hover tooltip and live-updating value/label.
Built with React and Tailwind. Copy the prompt and paste it into Claude Code, Cursor or Lovable: your agent adds Sparkline to your project and fits it to your theme.
Code
How Sparkline is used: the demo's code. The component's own source comes with a free account.
Usage.tsx
import { Sparkline, SparklineChart } from "@/components/ui/sparkline";

export default function SparklineArea() {
  return (
    <div className="flex w-64 max-w-full flex-col gap-6">
      <Sparkline data={[6, 11, 8, 16, 13, 22, 18, 27]}>
        <SparklineChart
          variant="area"
          height={56}
          aria-label="Signups over 8 weeks"
        />
      </Sparkline>
      <Sparkline data={[3, -4, 2, 6, -2, -6, 4, 1]}>
        <SparklineChart
          variant="area"
          height={56}
          aria-label="Net change over 8 weeks"
        />
      </Sparkline>
    </div>
  );
}
More by appica-dev
View all
Border Beam
43
Text Animate
19
Carousel
14
Table of Contents
6
Color Area
6
Avatar
6
Background Pattern
3
Autocomplete
2