
About
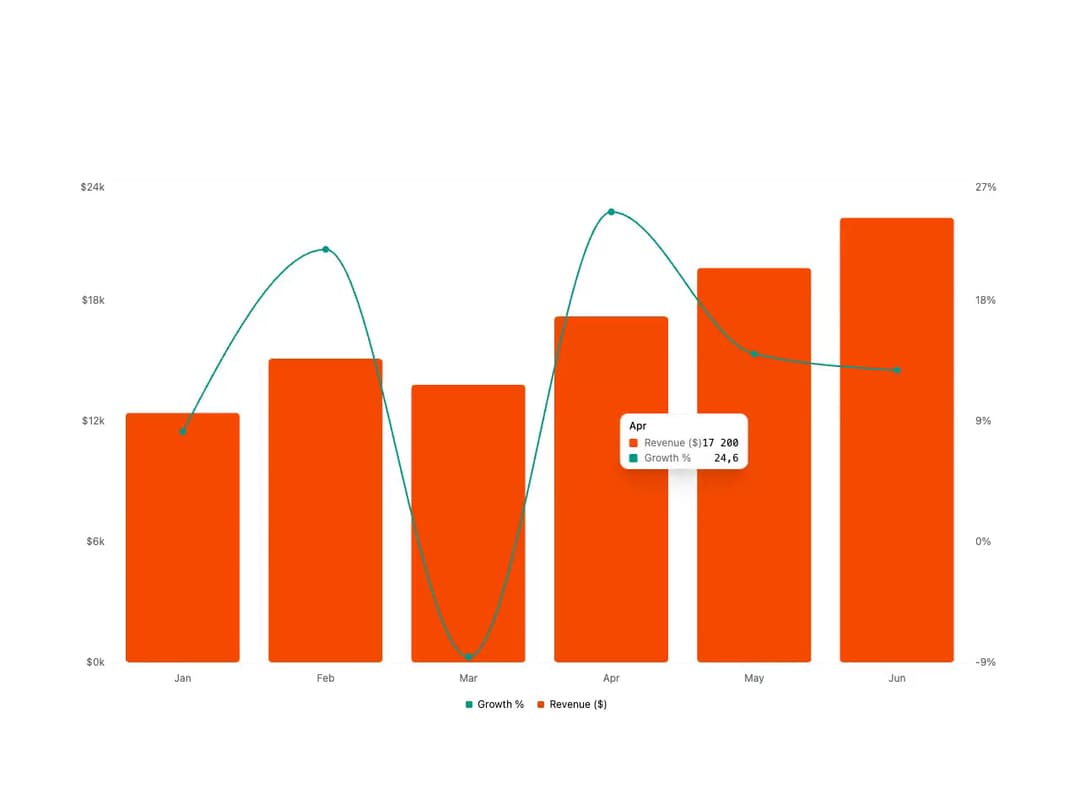
A set of composable chart primitives built on Recharts, providing a themeable ChartContainer plus ChartTooltip, ChartTooltipContent, ChartLegend and ChartLegendContent. Colors are driven by a typed ChartConfig and exposed as CSS variables, so the same wrappers render bar, line, area, pie, radar, radial and composed charts with consistent styling in light and dark mode.
Built with React and Tailwind. Copy the prompt and paste it into Claude Code, Cursor or Lovable: your agent adds Chart to your project and fits it to your theme.
Code
How Chart is used: the demo's code. The component's own source comes with a free account.
Usage.tsx
"use client";

import {
  Bar,
  CartesianGrid,
  ComposedChart,
  Line,
  XAxis,
  YAxis,
} from "recharts";
import {
  type ChartConfig,
  ChartContainer,
  ChartLegend,
  ChartLegendContent,
  ChartTooltip,
  ChartTooltipContent,
} from "@/components/ui/cnippet-chart";

const chartData = [
  { growth: 8.2, month: "Jan", revenue: 12400 },
  { growth: 21.8, month: "Feb", revenue: 15100 },
  { growth: -8.6, month: "Mar", revenue: 13800 },
  { growth: 24.6, month: "Apr", revenue: 17200 },
  { growth: 14.0, month: "May", revenue: 19600 },
  { growth: 12.8, month: "Jun", revenue: 22100 },
];

const chartConfig = {
  growth: { color: "var(--chart-2)", label: "Growth %" },
  revenue: { color: "var(--chart-1)", label: "Revenue ($)" },
} satisfies ChartConfig;

export default function Pattern() {
  return (
    <ChartContainer className="min-h-52 w-full" config={chartConfig}>
      <ComposedChart
        accessibilityLayer
        data={chartData}
        margin={{ left: 8, right: 16 }}
      >
        <CartesianGrid vertical={false} />
        <XAxis
          axisLine={false}
          dataKey="month"
          tickLine={false}
          tickMargin={8}
        />
        <YAxis
          axisLine={false}
          tickFormatter={(v) => `$${(v / 1000).toFixed(0)}k`}
          tickLine={false}
          width={44}
          yAxisId="left"
        />
        <YAxis
          axisLine={false}
          orientation="right"
          tickFormatter={(v) => `${v}%`}
          tickLine={false}
          width={36}
          yAxisId="right"
        />
        <ChartTooltip content={<ChartTooltipContent />} cursor={false} />
        <ChartLegend content={<ChartLegendContent />} />
        <Bar
          dataKey="revenue"
          fill="var(--color-revenue)"
          radius={4}
          yAxisId="left"
        />
        <Line
          dataKey="growth"
          dot={{ fill: "var(--color-growth)", r: 3 }}
          stroke="var(--color-growth)"
          strokeWidth={2}
          type="monotone"
          yAxisId="right"
        />
      </ComposedChart>
    </ChartContainer>
  );
}
Dependencies
More by Cnippet
View all

Team
1.3K
Davincho Hero-1
682
Aero Hero-3
558
Features
507
Random Letter Swap Navigation
484
Services with Animated Hover Modal
463
Blogs
396
Aero Hero-1
356