
About
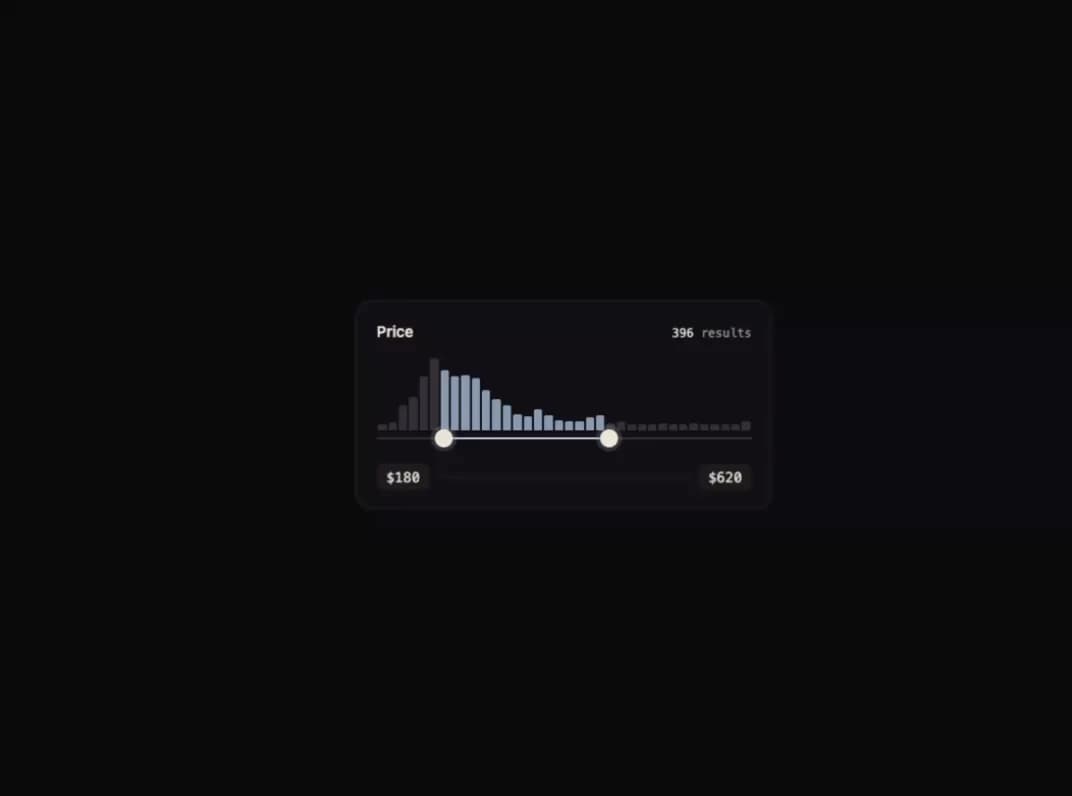
A two-thumb price range slider with a live histogram of the underlying data drawn behind the track, so bars inside the selected range light up and a result count updates as you drag.
Built with React and Tailwind. Copy the prompt and paste it into Claude Code, Cursor or Lovable: your agent adds Histogram Range to your project and fits it to your theme.
Code
How Histogram Range is used: the demo's code. The component's own source comes with a free account.
Usage.tsx
"use client";

import HistogramRange from "@/components/ui/histogram-range";
import { useMemo } from "react";

export default function Demo() {
  // a believable, right-skewed price distribution (deterministic PRNG, no external data)
  const values = useMemo(() => {
    let s = 7;
    const rand = () => (s = (s * 16807) % 2147483647) / 2147483647;
    return Array.from({ length: 640 }, () => {
      const u = rand(),
        v = rand();
      const n = Math.sqrt(-2 * Math.log(u)) * Math.cos(2 * Math.PI * v);
      return Math.max(20, Math.min(1000, Math.exp(5.4 + n * 0.55)));
    });
  }, []);
  return (
    <div className="flex min-h-full w-full items-center justify-center bg-[#0b080d] p-8">
      <HistogramRange values={values} />
    </div>
  );
}
More by ham7a311
View all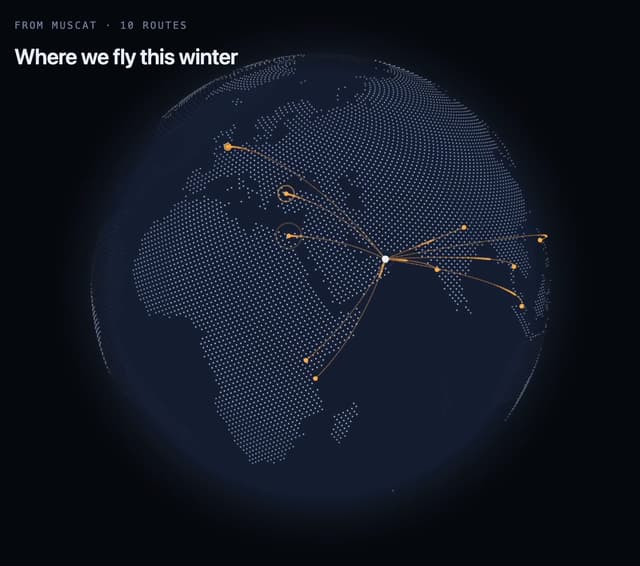
Route Globe
12
Wave Mesh
7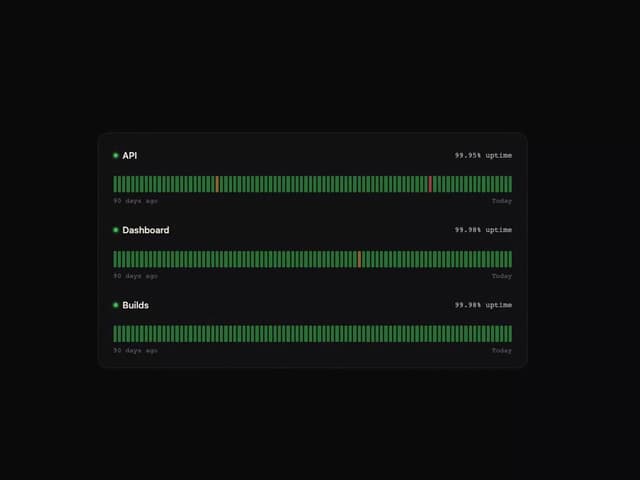
Uptime Ribbon
6
Glass Carousel
6
Glass Tiles
6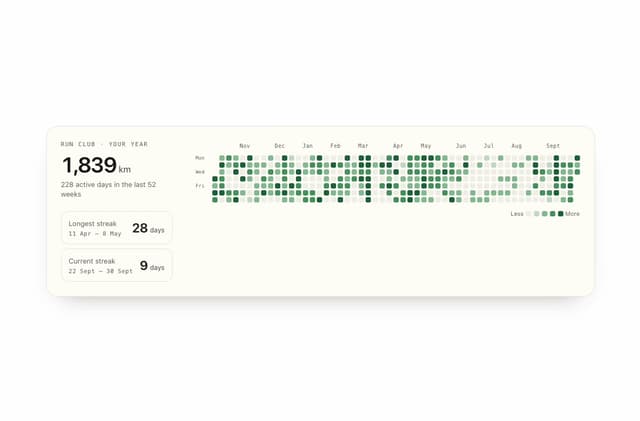
Streak Field Stats
5
Wind Map
5
Time Window
4