
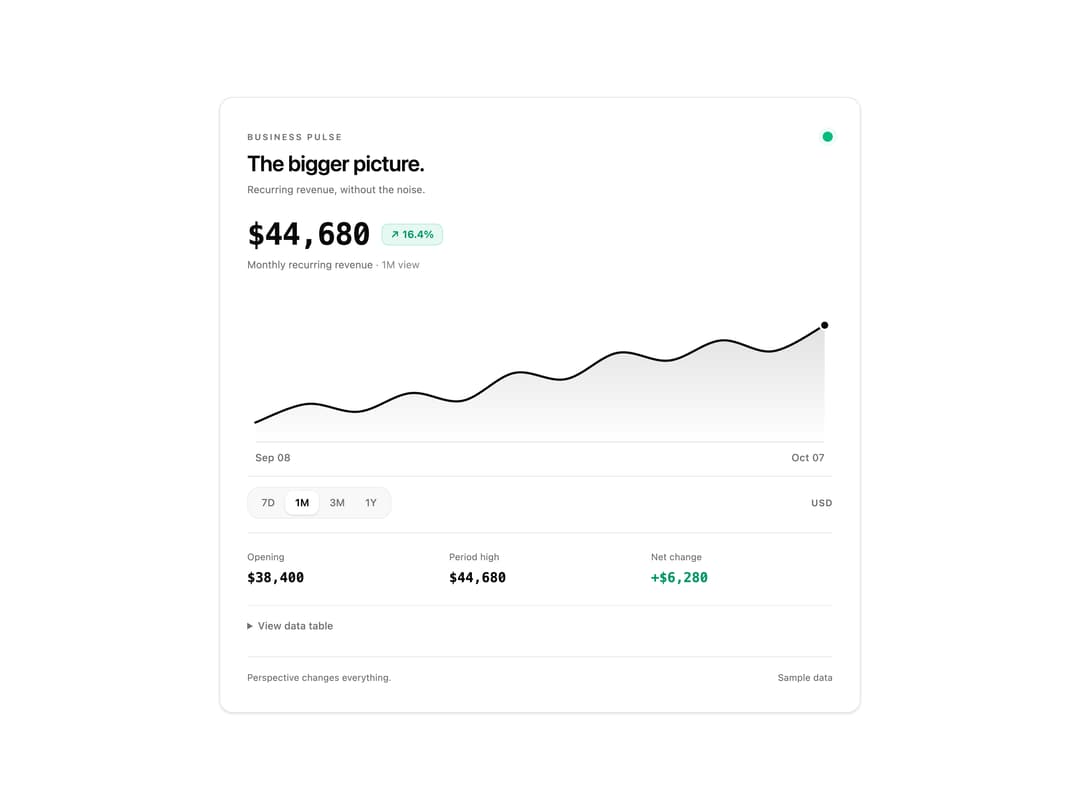
About
An interactive financial sparkline chart with multi-timeframe range switching, live status pulsing, dynamic percentage readouts, and an accessible data table. It is useful in fintech apps, SaaS analytics, and crypto trading dashboards to monitor recurring revenue and performance trends.
Built with React and Tailwind. Copy the prompt and paste it into Claude Code, Cursor or Lovable: your agent adds Selectable range sparkline to your project and fits it to your theme.
Code
How Selectable range sparkline is used: the demo's code. The component's own source comes with a free account.
Usage.tsx
"use client";

import * as React from "react";
import SelectableRangeSparkline, { type State } from "@/components/ui/selectable-range-sparkline";

const settings = { title: "The bigger picture." };
export const loopDuration = 6;

// Pure timeline: export frame n by passing n / 60. No timers or network calls.
export function showcase(time: number): State {
  const t = ((time % loopDuration) + loopDuration) % loopDuration;
  return { active: t < 1.2 ? 1 : t < 2.4 ? 0 : t < 3.6 ? 2 : t < 4.8 ? 3 : 1 };
}

export default function Demo(props: any = {}) {
  const { showcaseTime, ...incoming } = props;
  const merged = { ...settings, ...incoming };
  return (
    <div className="w-full min-h-[460px] flex items-center justify-center p-4 sm:p-6 bg-background">
      <SelectableRangeSparkline
        {...merged}
        state={showcaseTime === undefined ? incoming.state : showcase(showcaseTime)}
        seeking={showcaseTime !== undefined || incoming.seeking}
      />
    </div>
  );
}
More by Waqar H. Syed
View all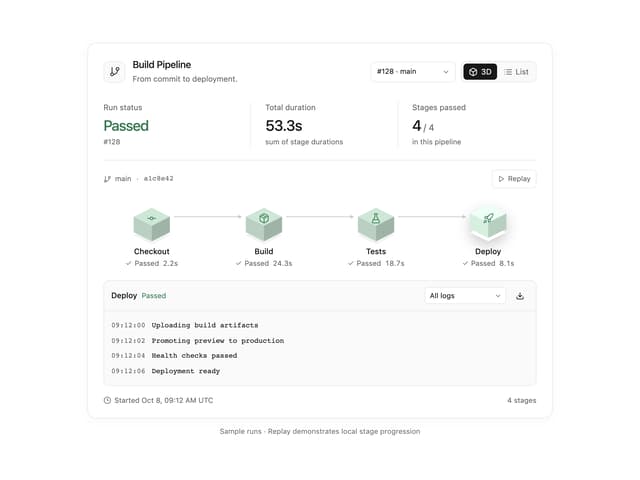
Build Pipeline
147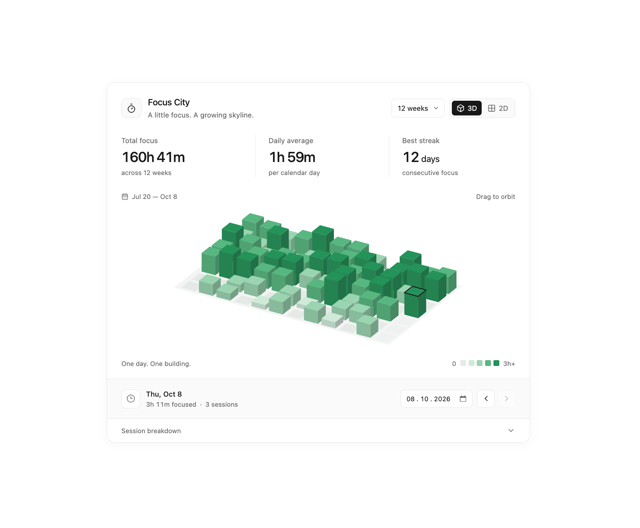
Focus City
110
Scroll animated timeline
110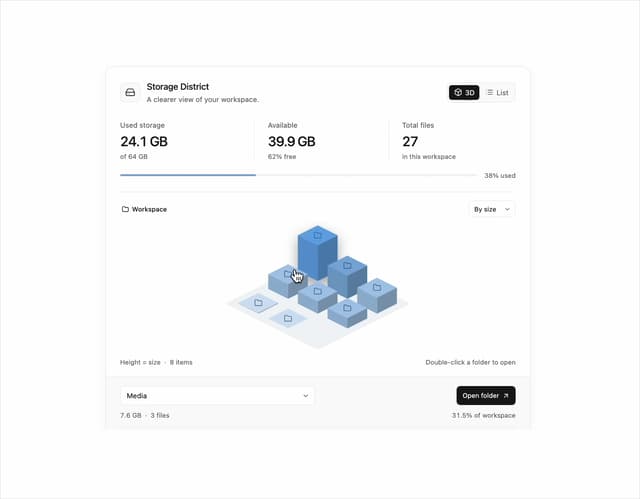
Storage District
64
Thumbnail image viewer
40
Glowing Pricing Tiers
39
Before after comparison
30
Featured Project Hero
28