
About
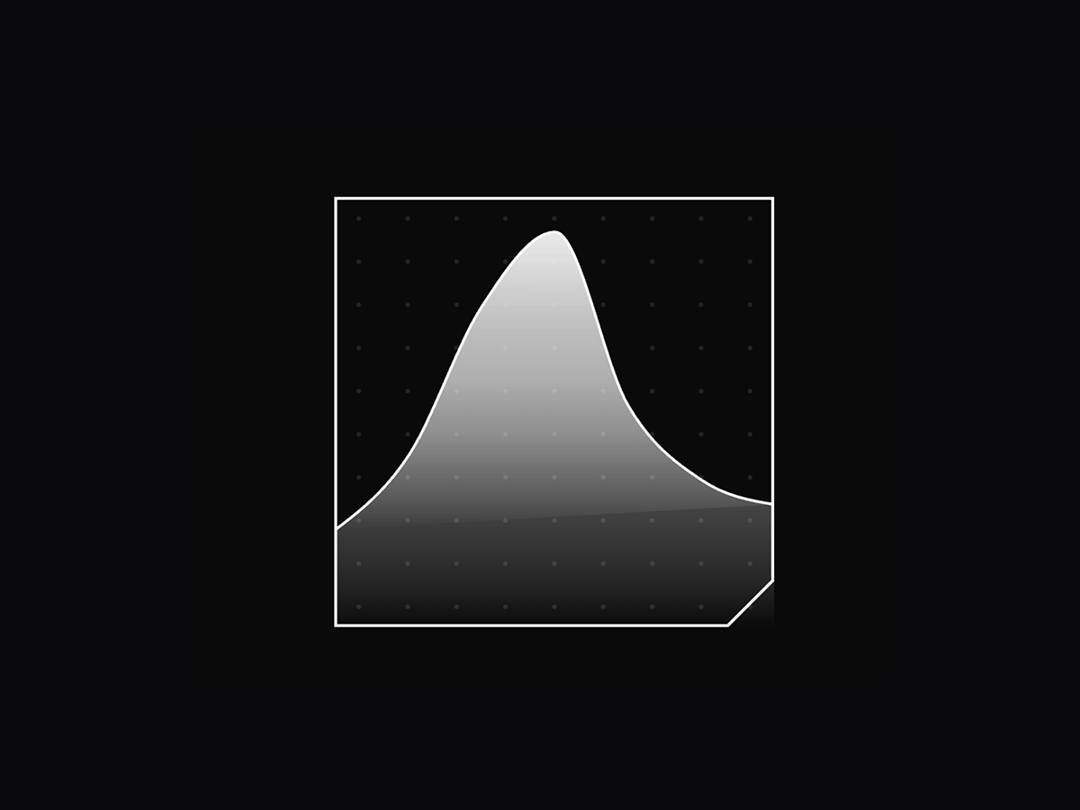
An animated area chart/graph component with a custom frame, perfect for HUD displays.
Built with React and Tailwind. Copy the prompt and paste it into Claude Code, Cursor or Lovable: your agent adds HUD Area Chart to your project and fits it to your theme.
Code
How HUD Area Chart is used: the demo's code. The component's own source comes with a free account.
Usage.tsx
"use client";

import { HudGraph } from "@/components/ui/hud-area-chart";

export function Demo() {
  // Sample data for the graph
  const data = [
    { time: "00:00", value: 20 },
    { time: "04:00", value: 35 },
    { time: "08:00", value: 65 },
    { time: "12:00", value: 80 },
    { time: "16:00", value: 45 },
    { time: "20:00", value: 30 },
    { time: "24:00", value: 25 },
  ];
  return (
    <div className="min-h-screen overflow-hidden flex items-center justify-center">
      <HudGraph showYAxis={false} data={data} />
    </div>
  );
}
Dependencies
More by Isaiah
View all
Agent Plan
2.2K
Video Scroll Hero
1.4K
Voice Powered Orb
1.3K
Reveal Text
1.1K
Leads Data Table
935
Portfolio Gallery
923
Message Dock
833
Ruler Carousel
618