
About
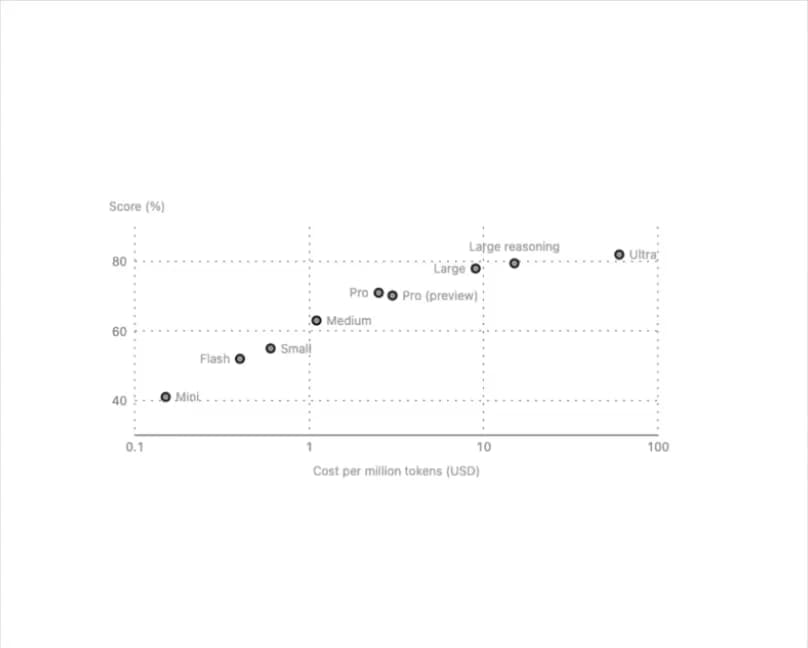
An accessible SVG chart (ported from elastic-ui's Vue component by Jose Estevez, MIT) that draws a line, grouped bars over categories, or loose points for one or more data series, with linear or log axes, a hover/keyboard-driven value readout, a legend for multiple series, and a screen-reader-only data table.
Built with React and Tailwind. Copy the prompt and paste it into Claude Code, Cursor or Lovable: your agent adds Chart to your project and fits it to your theme.
Code
How Chart is used: the demo's code. The component's own source comes with a free account.
Usage.tsx
import Chart from "@/components/ui/chart";

const BENCHMARK = [
  {
    name: "Models",
    points: [
      { x: 0.15, y: 41, label: "Mini" },
      { x: 0.4, y: 52, label: "Flash" },
      { x: 0.6, y: 55, label: "Small" },
      { x: 1.1, y: 63, label: "Medium" },
      { x: 2.5, y: 71, label: "Pro" },
      { x: 3, y: 70.2, label: "Pro (preview)" },
      { x: 9, y: 78, label: "Large" },
      { x: 15, y: 79.5, label: "Large reasoning" },
      { x: 60, y: 82, label: "Ultra" },
    ],
  },
];

export default function ChartPointsDemo() {
  return (
    <Chart
      series={BENCHMARK}
      variant="points"
      className="max-w-2xl"
      label="Benchmark score against cost per million tokens: the score rises with cost, but flattens past about ten dollars"
      x={{ title: "Cost per million tokens", unit: "USD", scale: "log" }}
      y={{ title: "Score", unit: "%", min: 30, max: 90 }}
    />
  );
}
More by joseestevez520
View all
Marquee
Day Strip

Prose
File Drop Zone