
About
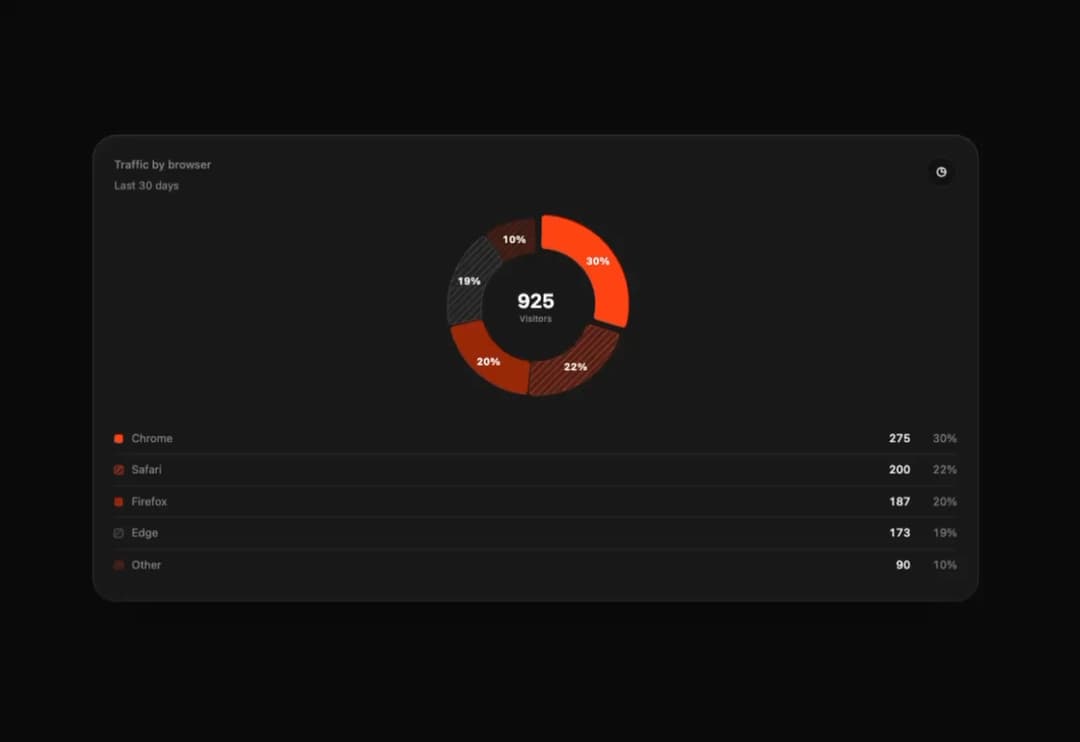
Donut, pie or gauge from your rows. Slices sweep in one after another, re-flow when toggled from the legend and pop out on hover.
Built with React and Tailwind. Copy the prompt and paste it into Claude Code, Cursor or Lovable: your agent adds Tweenly Chart Radial to your project and fits it to your theme.
Code
How Tweenly Chart Radial is used: the demo's code. The component's own source comes with a free account.
Usage.tsx
"use client";
import {ThemeProvider as LibraryDemoThemeProvider} from "next-themes";
import { ChartRadial } from "@/components/ui/tweenly-chart-radial"

const data = [
  { browser: "Chrome", visitors: 275 },
  { browser: "Safari", visitors: 200 },
  { browser: "Firefox", visitors: 187 },
  { browser: "Edge", visitors: 173 },
  { browser: "Other", visitors: 90 },
]

export function Demo() {
  return (
    <ChartRadial
      data={data}
      centerLabel="Visitors"
      highlight={0}
      title="Traffic by browser"
      description="Last 30 days"
      nameKey="browser"
      valueKey="visitors"
    />
  )
}

function SourceSpecimen(){return <Demo/>}
export default function LibraryRegistryPreview(){return <LibraryDemoThemeProvider defaultTheme="dark" enableSystem={false}><div data-component-demo data-demo-theme="dark" data-theme="dark" className="dark" style={{background:"var(--background)",color:"var(--foreground)"}}><div className="relative w-full min-w-0 max-w-5xl min-h-[400px] flex items-center justify-center"><SourceSpecimen/></div></div></LibraryDemoThemeProvider>}
Dependencies
More by mirukullacode
View all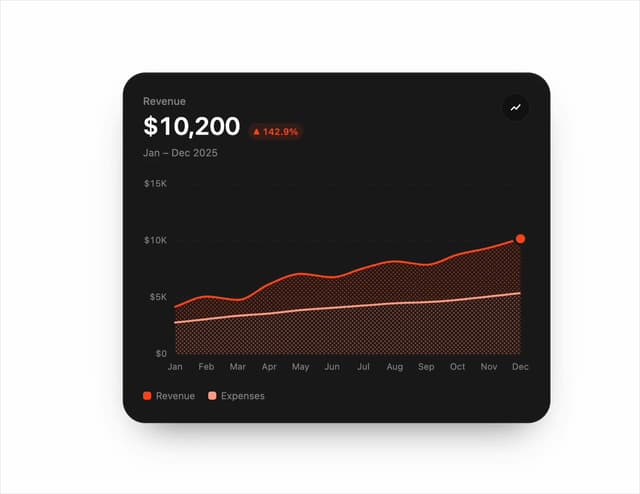
Chart Line
32
Tweenly AI Recorder
29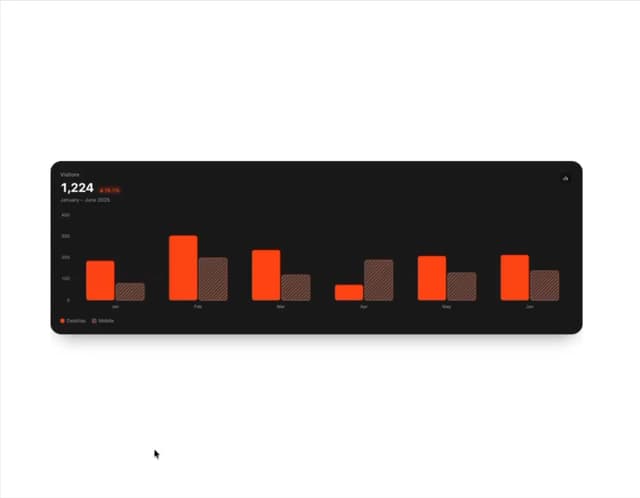
Animated Bar Chart
28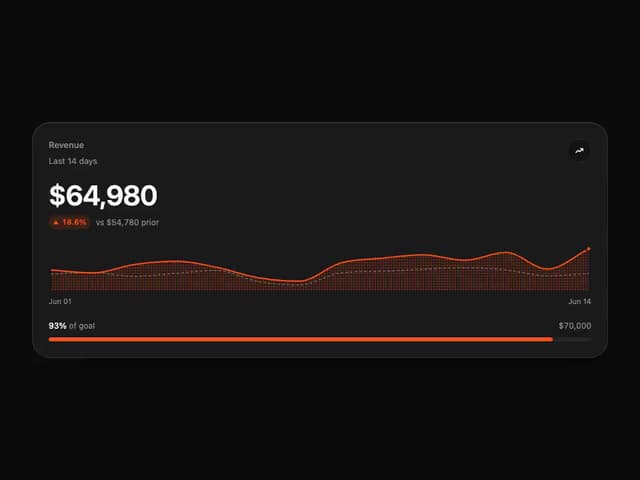
Tweenly Chart KPI
18
Tweenly Image Arc
15
Tweenly Hero Background
12
Tweenly Curved Carousel
12
Tweenly Elastic Switch
6