
About
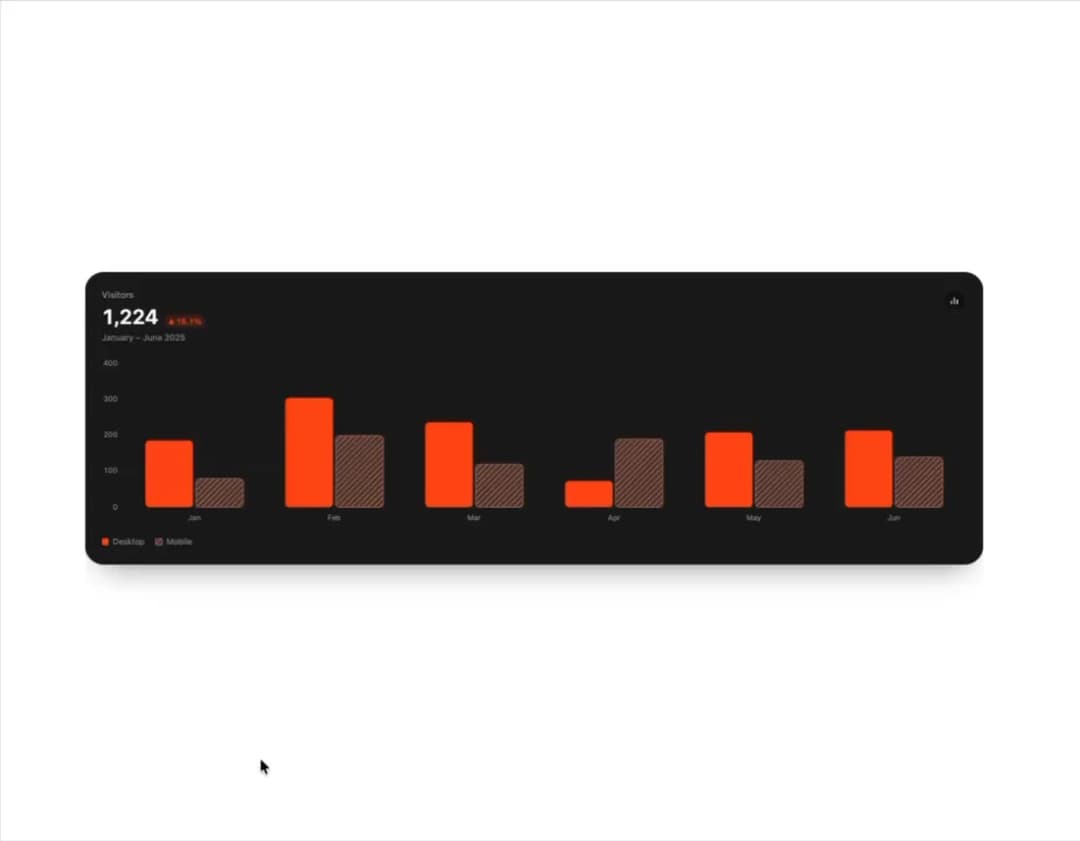
A grouped or stacked SVG bar chart (vertical or horizontal) with springy entrance animation, textured series fills, hover highlighting, tooltip, and a toggleable legend.
Built with React and Tailwind. Copy the prompt and paste it into Claude Code, Cursor or Lovable: your agent adds Animated Bar Chart to your project and fits it to your theme.
Code
How Animated Bar Chart is used: the demo's code. The component's own source comes with a free account.
Usage.tsx
import { ChartBar } from "@/components/ui/chart-bar";

const data = [
  { month: "Jan", desktop: 186, mobile: 80 },
  { month: "Feb", desktop: 305, mobile: 200 },
  { month: "Mar", desktop: 237, mobile: 120 },
  { month: "Apr", desktop: 73, mobile: 190 },
  { month: "May", desktop: 209, mobile: 130 },
  { month: "Jun", desktop: 214, mobile: 140 },
];

export default function Demo() {
  return (
    <ChartBar
      data={data}
      showLegend
      title="Visitors"
      description="January – June 2025"
      index="month"
      series={[
        { key: "desktop", label: "Desktop" },
        { key: "mobile", label: "Mobile" },
      ]}
    />
  );
}
Dependencies
More by mirukullacode
View all
Chart Line
32
Tweenly AI Recorder
28
Tweenly Chart KPI
18
Tweenly Chart Radial
16
Tweenly Image Arc
15
Tweenly Hero Background
12
Tweenly Curved Carousel
12
Tweenly Elastic Switch
6
More in Dashboards
View all
Dashboard with Collapsible Sidebar
2.4K

Sidebar
234

SaaS Template
2.4K

Chat template
598
Stats Bento
1.1K

Financial Bento Grid
71

Statistics Card 2
264

Course Design Cards
1.1K

