
About
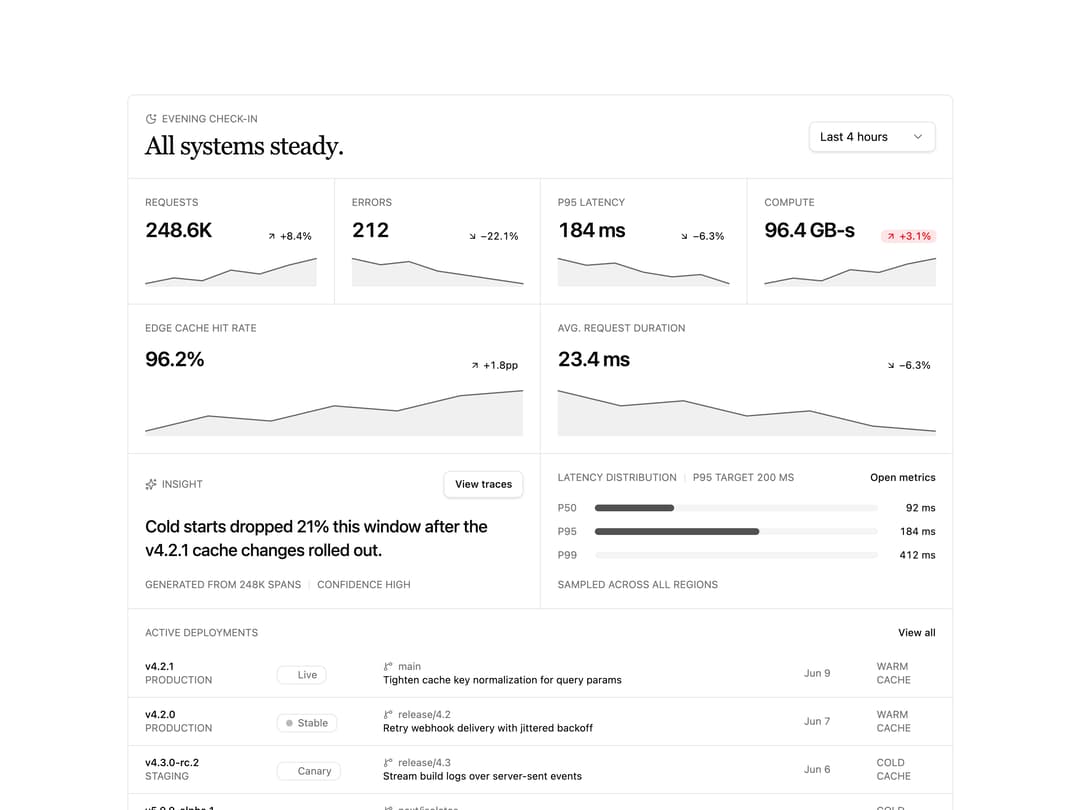
Observability dashboard composed as one bordered lattice: greeting strip with range select, four sparkline KPI cells, cache and duration chart cells, an AI-insight callout, a P50/P95/P99 latency distribution measured against a stated target, and an active-deployments list. The deployment taking traffic is marked in the primary color and its pulse respects prefers-reduced-motion.
Built with React and Tailwind. Copy the prompt and paste it into Claude Code, Cursor or Lovable: your agent adds Observability Dashboard to your project and fits it to your theme.
Code
How Observability Dashboard is used: the demo's code. The component's own source comes with a free account.
Usage.tsx
import Dashboard05 from "@/components/ui/dashboard-05";

export default function Dashboard05Demo() {
  return <Dashboard05 />;
}
Dependencies
More by Mohammad Shehadeh
View all
Feature Problem Cards
84
Feature Grid Spotlight Cards
70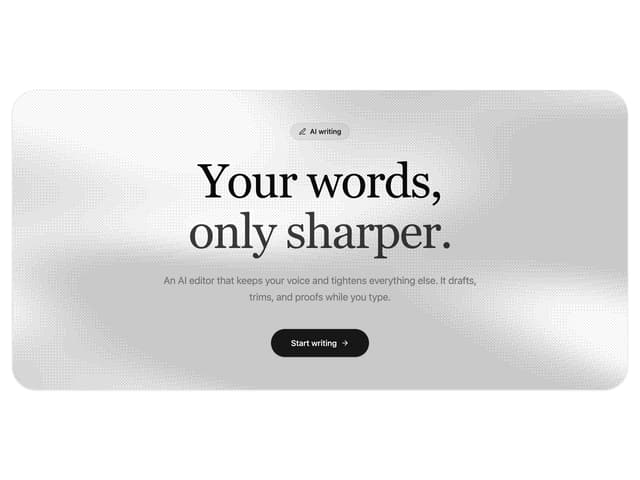
Dithered Shader CTA
63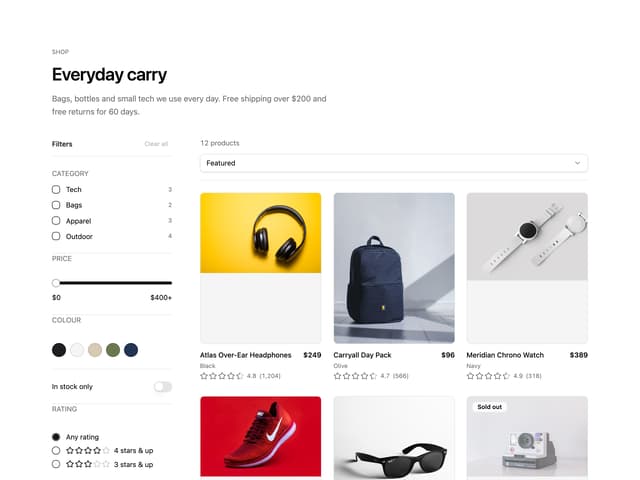
Ecommerce Category Page
61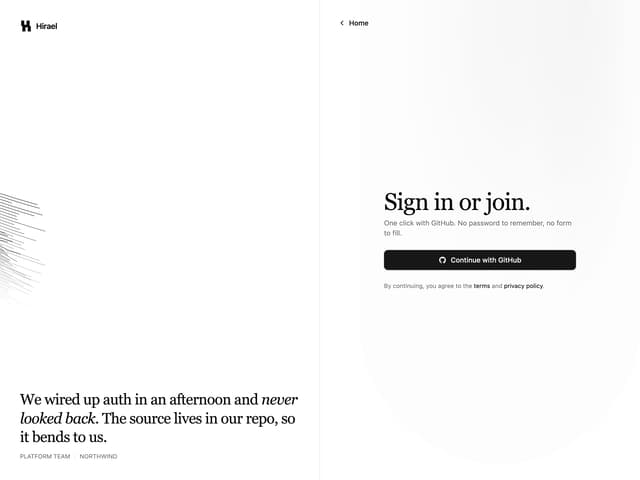
Split Login
60
Comparison Table
59
FAQ Two Column
59
Comparison Section
57
More in Dashboards
View all
Dashboard with Collapsible Sidebar
2.4K

Sidebar
235

SaaS Template
2.4K
Stats Bento
1.1K
Stats cards with links
33

Financial Bento Grid
71

Course Design Cards
1.1K

Chat template
598


