
About
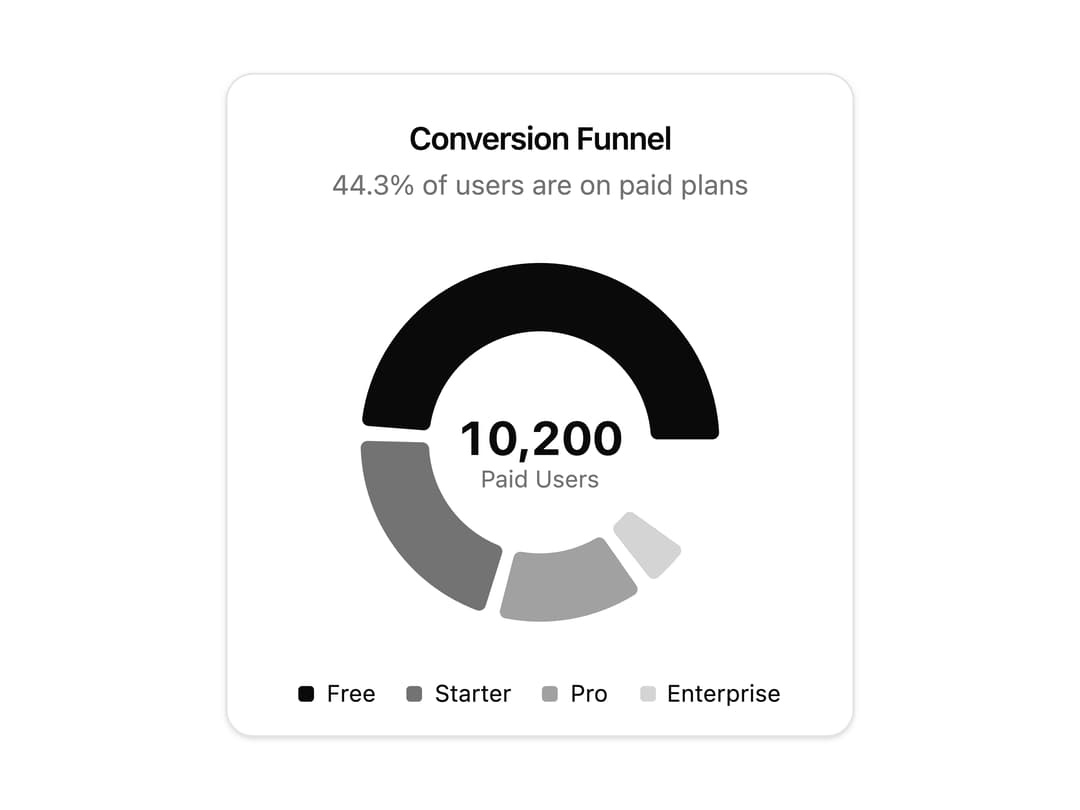
A donut chart with an active-segment hover effect and a center label showing the total, used to visualize conversion or plan distribution.
Built with React and Tailwind. Copy the prompt and paste it into Claude Code, Cursor or Lovable: your agent adds Conversion Funnel Donut Chart to your project and fits it to your theme.
Code
How Conversion Funnel Donut Chart is used: the demo's code. The component's own source comes with a free account.
Usage.tsx
import Pattern from "@/components/ui/c-chart-22";

export default function Demo() {
  return <Pattern />;
}
Dependencies
More by Sean Hello
View all

3D Testimonails
3.3K
Line Charts 9
632
Alert
492
Area Charts 1
384
Line Charts 6
382
Scroll Area
376
Area Charts 2
316
Navigation Menu
305