
About
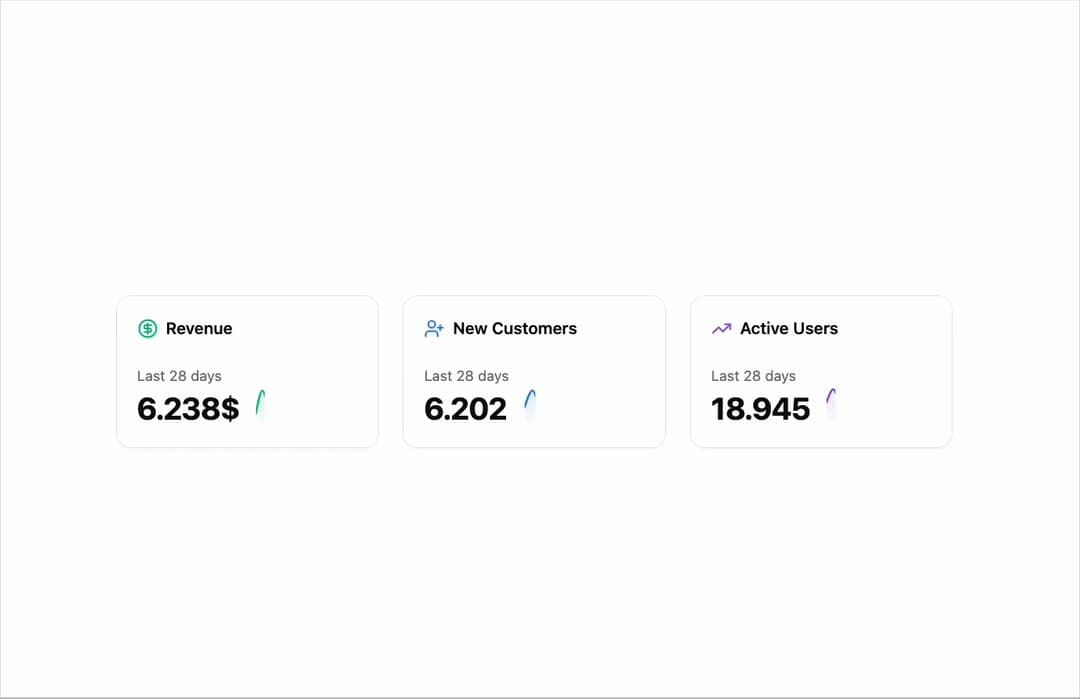
Area charts designed to present key metrics and insights. Each chart features unique layouts, data visualizations, and styling options. Perfect for dashboards, admin panels, and analytics pages.
Built with React and Tailwind. Copy the prompt and paste it into Claude Code, Cursor or Lovable: your agent adds Area Charts 1 to your project and fits it to your theme.
Code
How Area Charts 1 is used: the demo's code. The component's own source comes with a free account.
Usage.tsx
'use client';

import React from 'react';
import { Card, CardContent } from '@/components/ui/card';
import { CircleDollarSign, TrendingUp, UserPlus } from 'lucide-react';
import { Area, AreaChart, ResponsiveContainer, Tooltip } from 'recharts';

// Business Case 1: SaaS Revenue Tracking
const revenueData = [
  { value: 1000 },
  { value: 4500 },
  { value: 2000 },
  { value: 5200 },
  { value: 1500 },
  { value: 6100 },
  { value: 3000 },
  { value: 6800 },
  { value: 2000 },
  { value: 1000 },
  { value: 4000 },
  { value: 2000 },
  { value: 3000 },
  { value: 2000 },
  { value: 6238 },
];

// Business Case 2: New Customer Acquisition
const customersData = [
  { value: 2000 },
  { value: 4500 },
  { value: 2000 },
  { value: 5200 },
  { value: 1500 },
  { value: 5100 },
  { value: 2500 },
  { value: 6800 },
  { value: 1800 },
  { value: 1000 },
  { value: 3000 },
  { value: 2000 },
  { value: 2700 },
  { value: 2000 },
  { value: 4238 },
];

// Business Case 3: Monthly Active Users
const activeUsersData = [
  { value: 2000 },
  { value: 3500 },
  { value: 2000 },
  { value: 5200 },
  { value: 1200 },
  { value: 4100 },
  { value: 3500 },
  { value: 5800 },
  { value: 2000 },
  { value: 800 },
  { value: 3000 },
  { value: 1000 },
  { value: 4000 },
  { value: 2000 },
  { value: 4238 },
];

// Business cards configuration
// Use custom or Tailwind standard colors: https://tailwindcss.com/docs/colors
const businessCards = [
  {
    title: 'Revenue',
    period: 'Last 28 days',
    value: '6.238$',
    timestamp: '',
    data: revenueData,
    color: 'var(--color-emerald-500)',
    icon: CircleDollarSign,
    gradientId: 'revenueGradient',
  },
  {
    title: 'New Customers',
    period: 'Last 28 days',
    value: '6.202',
    timestamp: '3h ago',
    data: customersData,
    color: 'var(--color-blue-500)',
    icon: UserPlus,
    gradientId: 'customersGradient',
  },
  {
    title: 'Active Users',
    period: 'Last 28 days',
    value: '18.945',
    timestamp: '1h ago',
    data: activeUsersData,
    color: 'var(--color-violet-500)',
    icon: TrendingUp,
    gradientId: 'usersGradient',
  },
];

export default function AreaChart1() {
  return (
    <div className="w-full max-w-5xl min-h-screen flex items-center justify-center p-6 lg:p-8">
      <div className="@container w-full max-w-6xl">
        {/* Grid of 3 cards */}
        <div className="grid grid-cols-1 @3xl:grid-cols-3 gap-6">
          {businessCards.map((card, i) => {
            const Icon = card.icon;
            return (
              <Card key={i}>
                <CardContent className="space-y-5">
                  {/* Header with icon and title */}
                  <div className="flex items-center gap-2">
                    <Icon className="size-5" style={{ color: card.color }} />
                    <span className="text-base font-semibold">{card.title}</span>
                  </div>

                  <div className="flex items-end gap-2.5 justify-between">
                    {/* Details */}
                    <div className="flex flex-col gap-1">
                      {/* Period */}
                      <div className="text-sm text-muted-foreground whitespace-nowrap">{card.period}</div>

                      {/* Value */}
                      <div className="text-3xl font-bold text-foreground tracking-tight">{card.value}</div>
                    </div>

                    {/* Chart */}
                    <div className="max-w-40 h-16 w-full relative">
                      <ResponsiveContainer width="100%" height="100%">
                        <AreaChart
                          data={card.data}
                          margin={{
                            top: 5,
                            right: 5,
                            left: 5,
                            bottom: 5,
                          }}
                        >
                          <defs>
                            <linearGradient id={card.gradientId} x1="0" y1="0" x2="0" y2="1">
                              <stop offset="0%" stopColor={card.color} stopOpacity={0.3} />
                              <stop offset="100%" stopColor={card.color} stopOpacity={0.05} />
                            </linearGradient>
                            <filter id={`dotShadow${i}`} x="-50%" y="-50%" width="200%" height="200%">
                              <feDropShadow dx="2" dy="2" stdDeviation="3" floodColor="rgba(0,0,0,0.5)" />
                            </filter>
                          </defs>

                          <Tooltip
                            cursor={{ stroke: card.color, strokeWidth: 1, strokeDasharray: '2 2' }}
                            content={({ active, payload }) => {
                              if (active && payload && payload.length) {
                                const value = payload[0].value as number;
                                const formatValue = (val: number) => {
                                  if (card.title === 'Revenue') {
                                    return `${(val / 1000).toFixed(1)}k US$`;
                                  } else if (card.title === 'New Customers') {
                                    return `${(val / 1000).toFixed(1)}k`;
                                  } else {
                                    return `${(val / 1000).toFixed(1)}k`;
                                  }
                                };

                                return (
                                  <div className="bg-background/95 backdrop-blur-sm border border-border shadow-lg rounded-lg p-2 pointer-events-none">
                                    <p className="text-sm font-semibold text-foreground">{formatValue(value)}</p>
                                  </div>
                                );
                              }
                              return null;
                            }}
                          />

                          {/* Area with gradient and enhanced shadow */}
                          <Area
                            type="monotone"
                            dataKey="value"
                            stroke={card.color}
                            fill={`url(#${card.gradientId})`}
                            strokeWidth={2}
                            dot={false}
                            activeDot={{
                              r: 6,
                              fill: card.color,
                              stroke: 'white',
                              strokeWidth: 2,
                              filter: `url(#dotShadow${i})`,
                            }}
                          />
                        </AreaChart>
                      </ResponsiveContainer>
                    </div>
                  </div>
                </CardContent>
              </Card>
            );
          })}
        </div>
      </div>
    </div>
  );
}
More by Sean Hello
View all

3D Testimonails
3.3K
Line Charts 9
632
Alert
492
Line Charts 6
382
Scroll Area
376
Area Charts 2
316
Navigation Menu
305
Statistics Card 7
289
More in Cards
View all

Course Design Cards
1.1K
Stats cards with links
121
Statistics Card 2
259
Card
56

Card Studio
9
The Item one
3

Weather Card
54
Dashboard with Collapsible Sidebar
2.4K

