
About
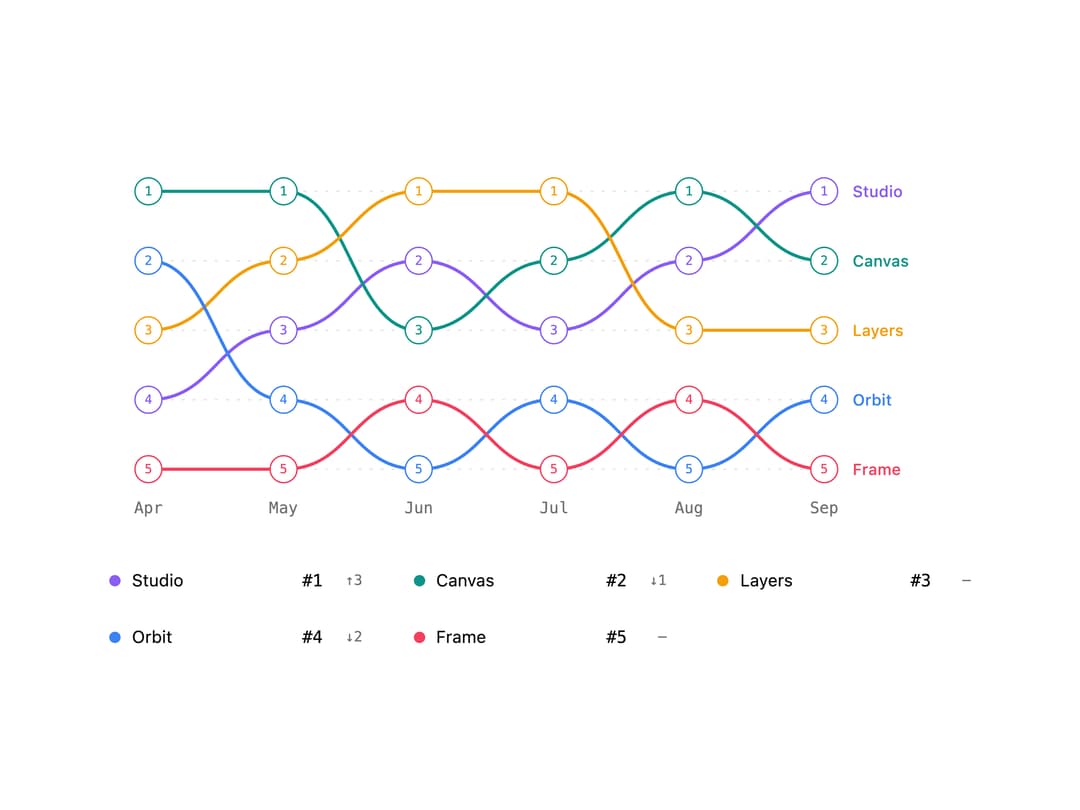
An animated chart that shows how items swap rank across time periods, with curved connecting paths, interactive rank dots, hover tooltips, and a highlightable legend.
Built with React and Tailwind. Copy the prompt and paste it into Claude Code, Cursor or Lovable: your agent adds Bump Chart to your project and fits it to your theme.
Code
How Bump Chart is used: the demo's code. The component's own source comes with a free account.
Usage.tsx
"use client";

import {
  BumpChart,
  BumpChartLegend,
  BumpChartPlot,
  type BumpChartSeries,
} from "@/components/ui/bump-chart";

const periods = ["Apr", "May", "Jun", "Jul", "Aug", "Sep"];

const series: BumpChartSeries[] = [
  { id: "studio", name: "Studio", ranks: [4, 3, 2, 3, 2, 1] },
  { id: "canvas", name: "Canvas", ranks: [1, 1, 3, 2, 1, 2] },
  { id: "layers", name: "Layers", ranks: [3, 2, 1, 1, 3, 3] },
  { id: "orbit", name: "Orbit", ranks: [2, 4, 5, 4, 5, 4] },
  { id: "frame", name: "Frame", ranks: [5, 5, 4, 5, 4, 5] },
];

export default function BumpChartDemo() {
  return (
    <div className="w-full max-w-2xl p-6">
      <BumpChart
        series={series}
        periods={periods}
        label="Product rankings, April to September"
      >
        <BumpChartPlot />
        <BumpChartLegend />
      </BumpChart>
    </div>
  );
}
More by Saurabh
View all
BeUI Tilt Card
369
BeUI Expandable Tabs
345
BeUI File Upload
291
BeUI Bouncy Accordion
200
BeUI Create Menu
199
BeUI Expanable Action Bar
183
Loader
173
BeUI OTP Input
166