
About
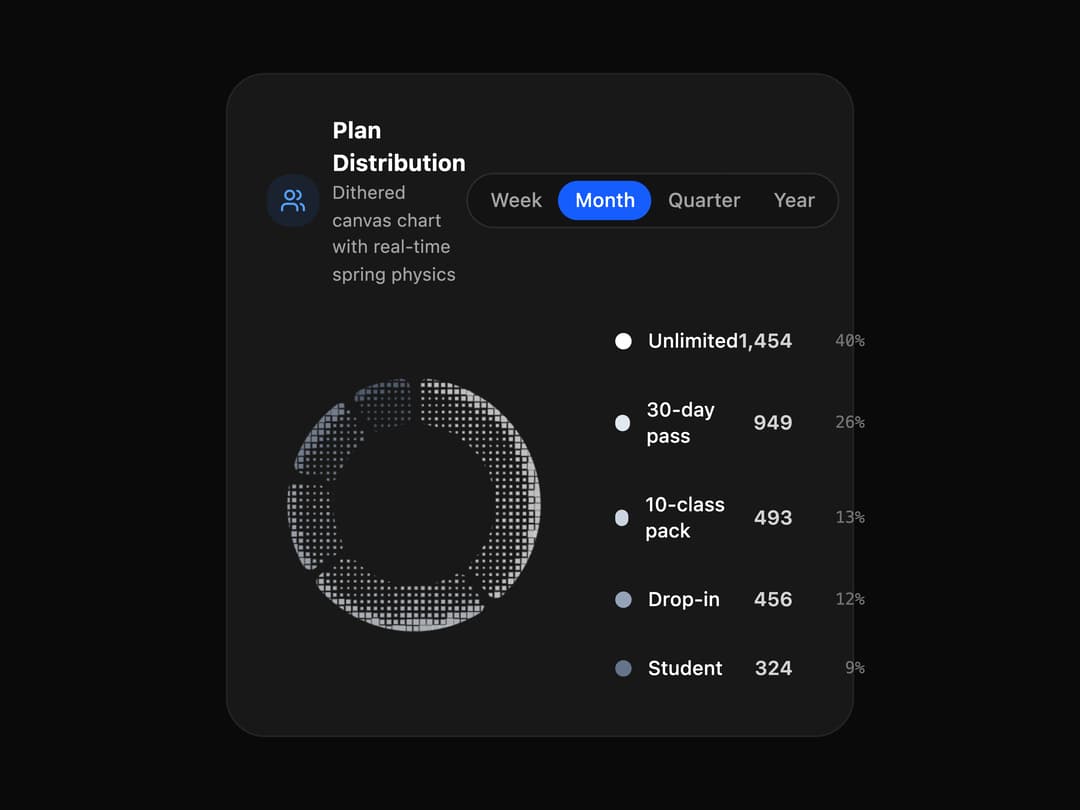
An animated donut/pie chart rendered on canvas with a pixelated 1-bit dither shading effect, spring-based morphing between values, and hoverable segments — useful for showing plan/category distribution breakdowns.
Built with React and Tailwind. Copy the prompt and paste it into Claude Code, Cursor or Lovable: your agent adds Dither Donut Chart to your project and fits it to your theme.
Code
How Dither Donut Chart is used: the demo's code. The component's own source comes with a free account.
Usage.tsx
import DitherDonutChart from "@/components/ui/dither-donut-chart";

export default function DitherDonutChartDemo() {
  return (
    <div className="w-full h-screen flex items-center justify-center bg-neutral-950 p-6">
      <div className="w-full max-w-sm">
        <DitherDonutChart theme="dark" />
      </div>
    </div>
  );
}
Dependencies
More by Subhan Uddin
View all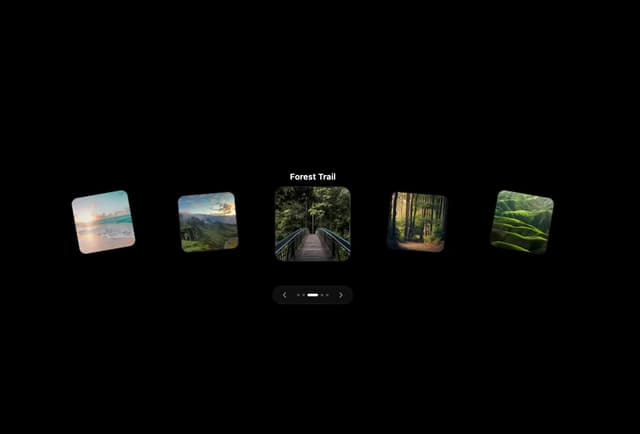

Interactive 3D Card Carousel
58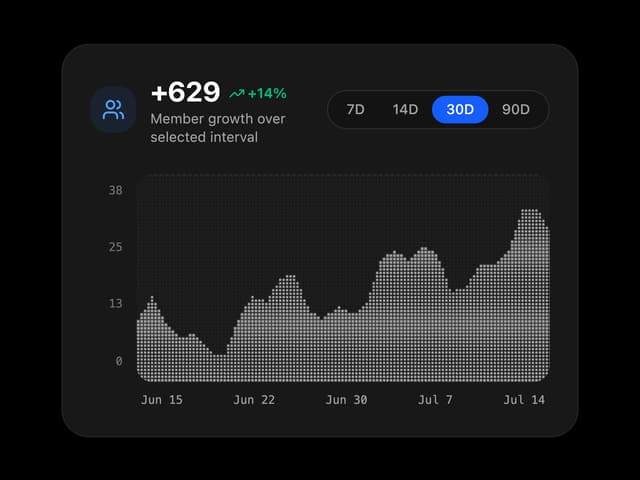
Dither Growth Chart
25
Dots Ring
23
Waveform Loader
15
Page Transition
12
Bouncing Square
12
Intersecting Rings
11
Bouncing Dots
10