About
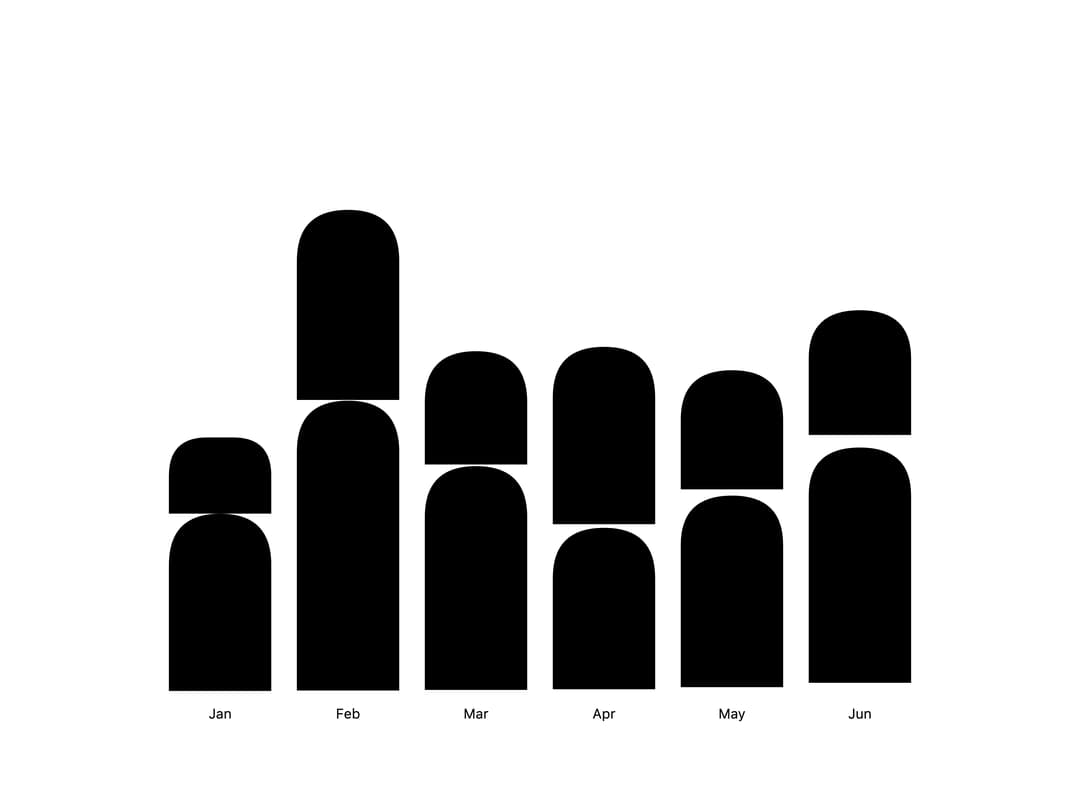
Here is Bar Chart component
Built with React and Tailwind. Copy the prompt and paste it into Claude Code, Cursor or Lovable: your agent adds Bar Chart to your project and fits it to your theme.
Code
How Bar Chart is used: the demo's code. The component's own source comes with a free account.
Usage.tsx
"use client";

import {
  BarChart,
  Bar,
  Grid,
  ChartTooltip,
  BarXAxis,
} from "@/components/ui/bar-chart";

const data = [
  { name: "Jan", desktop: 186, mobile: 80 },
  { name: "Feb", desktop: 305, mobile: 200 },
  { name: "Mar", desktop: 237, mobile: 120 },
  { name: "Apr", desktop: 173, mobile: 190 },
  { name: "May", desktop: 209, mobile: 130 },
  { name: "Jun", desktop: 264, mobile: 140 },
];

const settings = {
  barGap: 0.2,
  stackGap: 4,
  strokeWidth: 1,
  strokeOpacity: 1,
  animationDuration: 1100,
  fadedOpacity: 0.3,
};

export default function Demo(props: Partial<typeof settings>) {
  const s = { ...settings, ...props };

  return (
    <div className="flex h-screen w-screen items-center justify-center p-6">
      <div className="w-full max-w-3xl">
        <BarChart
          data={data}
          xDataKey="name"
          stacked
          aspectRatio="4 / 3"
          barGap={s.barGap}
          stackGap={s.stackGap}
          animationDuration={s.animationDuration}
        >
          <Grid strokeWidth={s.strokeWidth} strokeOpacity={s.strokeOpacity} />
          <Bar
            dataKey="desktop"
            fill="var(--chart-line-primary)"
            fadedOpacity={s.fadedOpacity}
          />
          <Bar
            dataKey="mobile"
            fill="var(--chart-line-secondary)"
            fadedOpacity={s.fadedOpacity}
          />
          <BarXAxis />
          <ChartTooltip />
        </BarChart>
      </div>
    </div>
  );
}
Dependencies
More by bklitai
View all

Funnel Chart
397
Area Chart
356
Sankey Diagram
29
Candlestick Chart
10