HomeBookmarks
BklitBklit
Bklit

Bklit

React component library of design-engineered charts and data-visualization components.

BKby bklitai
29components171.8Kviews2Kbookmarks

Installs all 39 components. Without our CLI, run instead.

Auto-indexed

Bklit contents
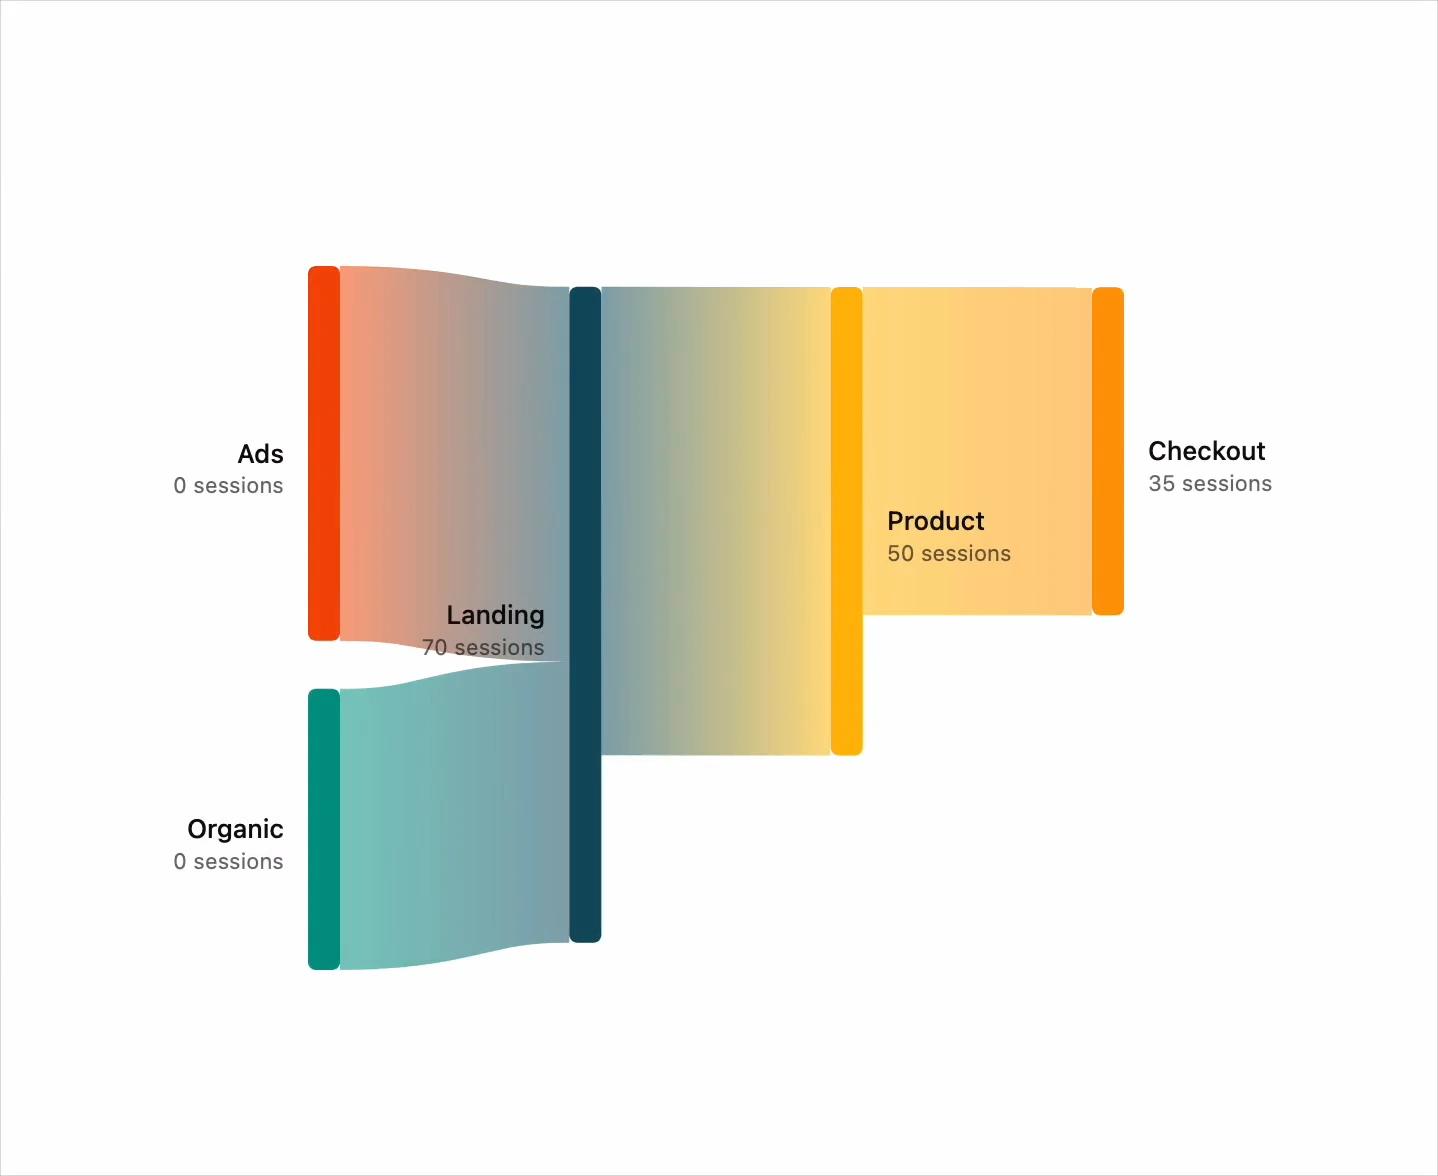
  • Sankey Diagram

    Sankey Diagram

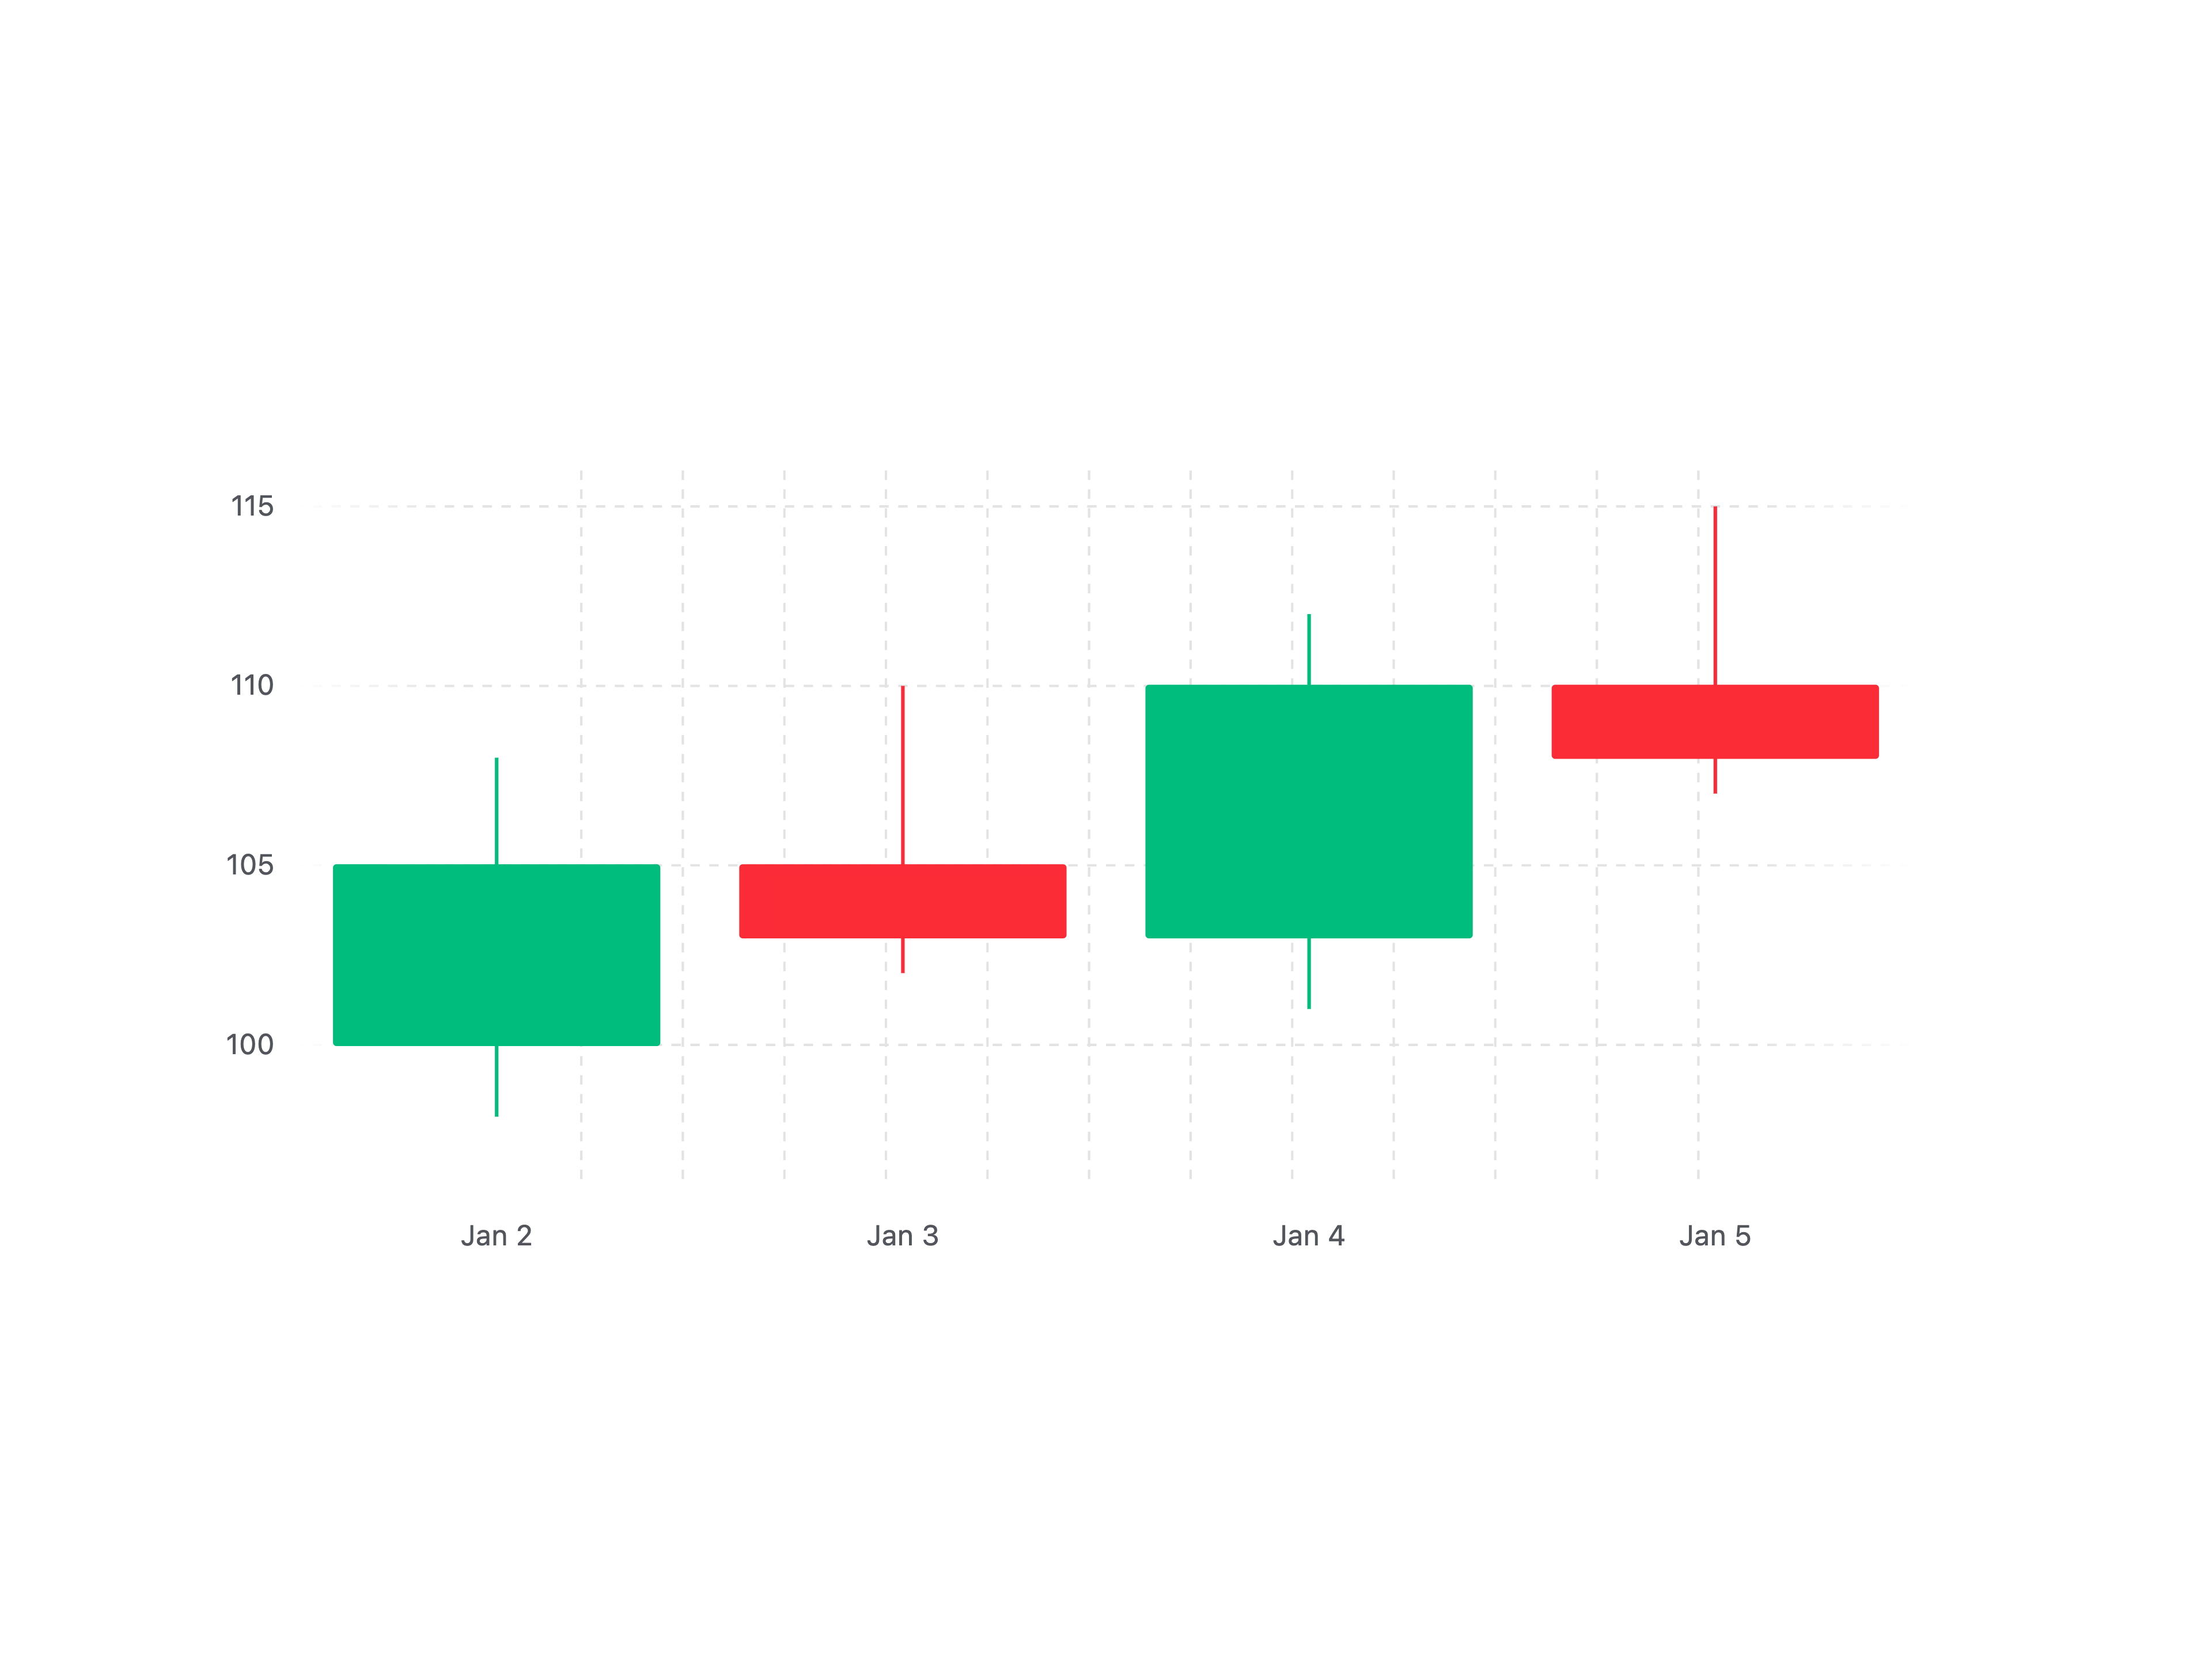
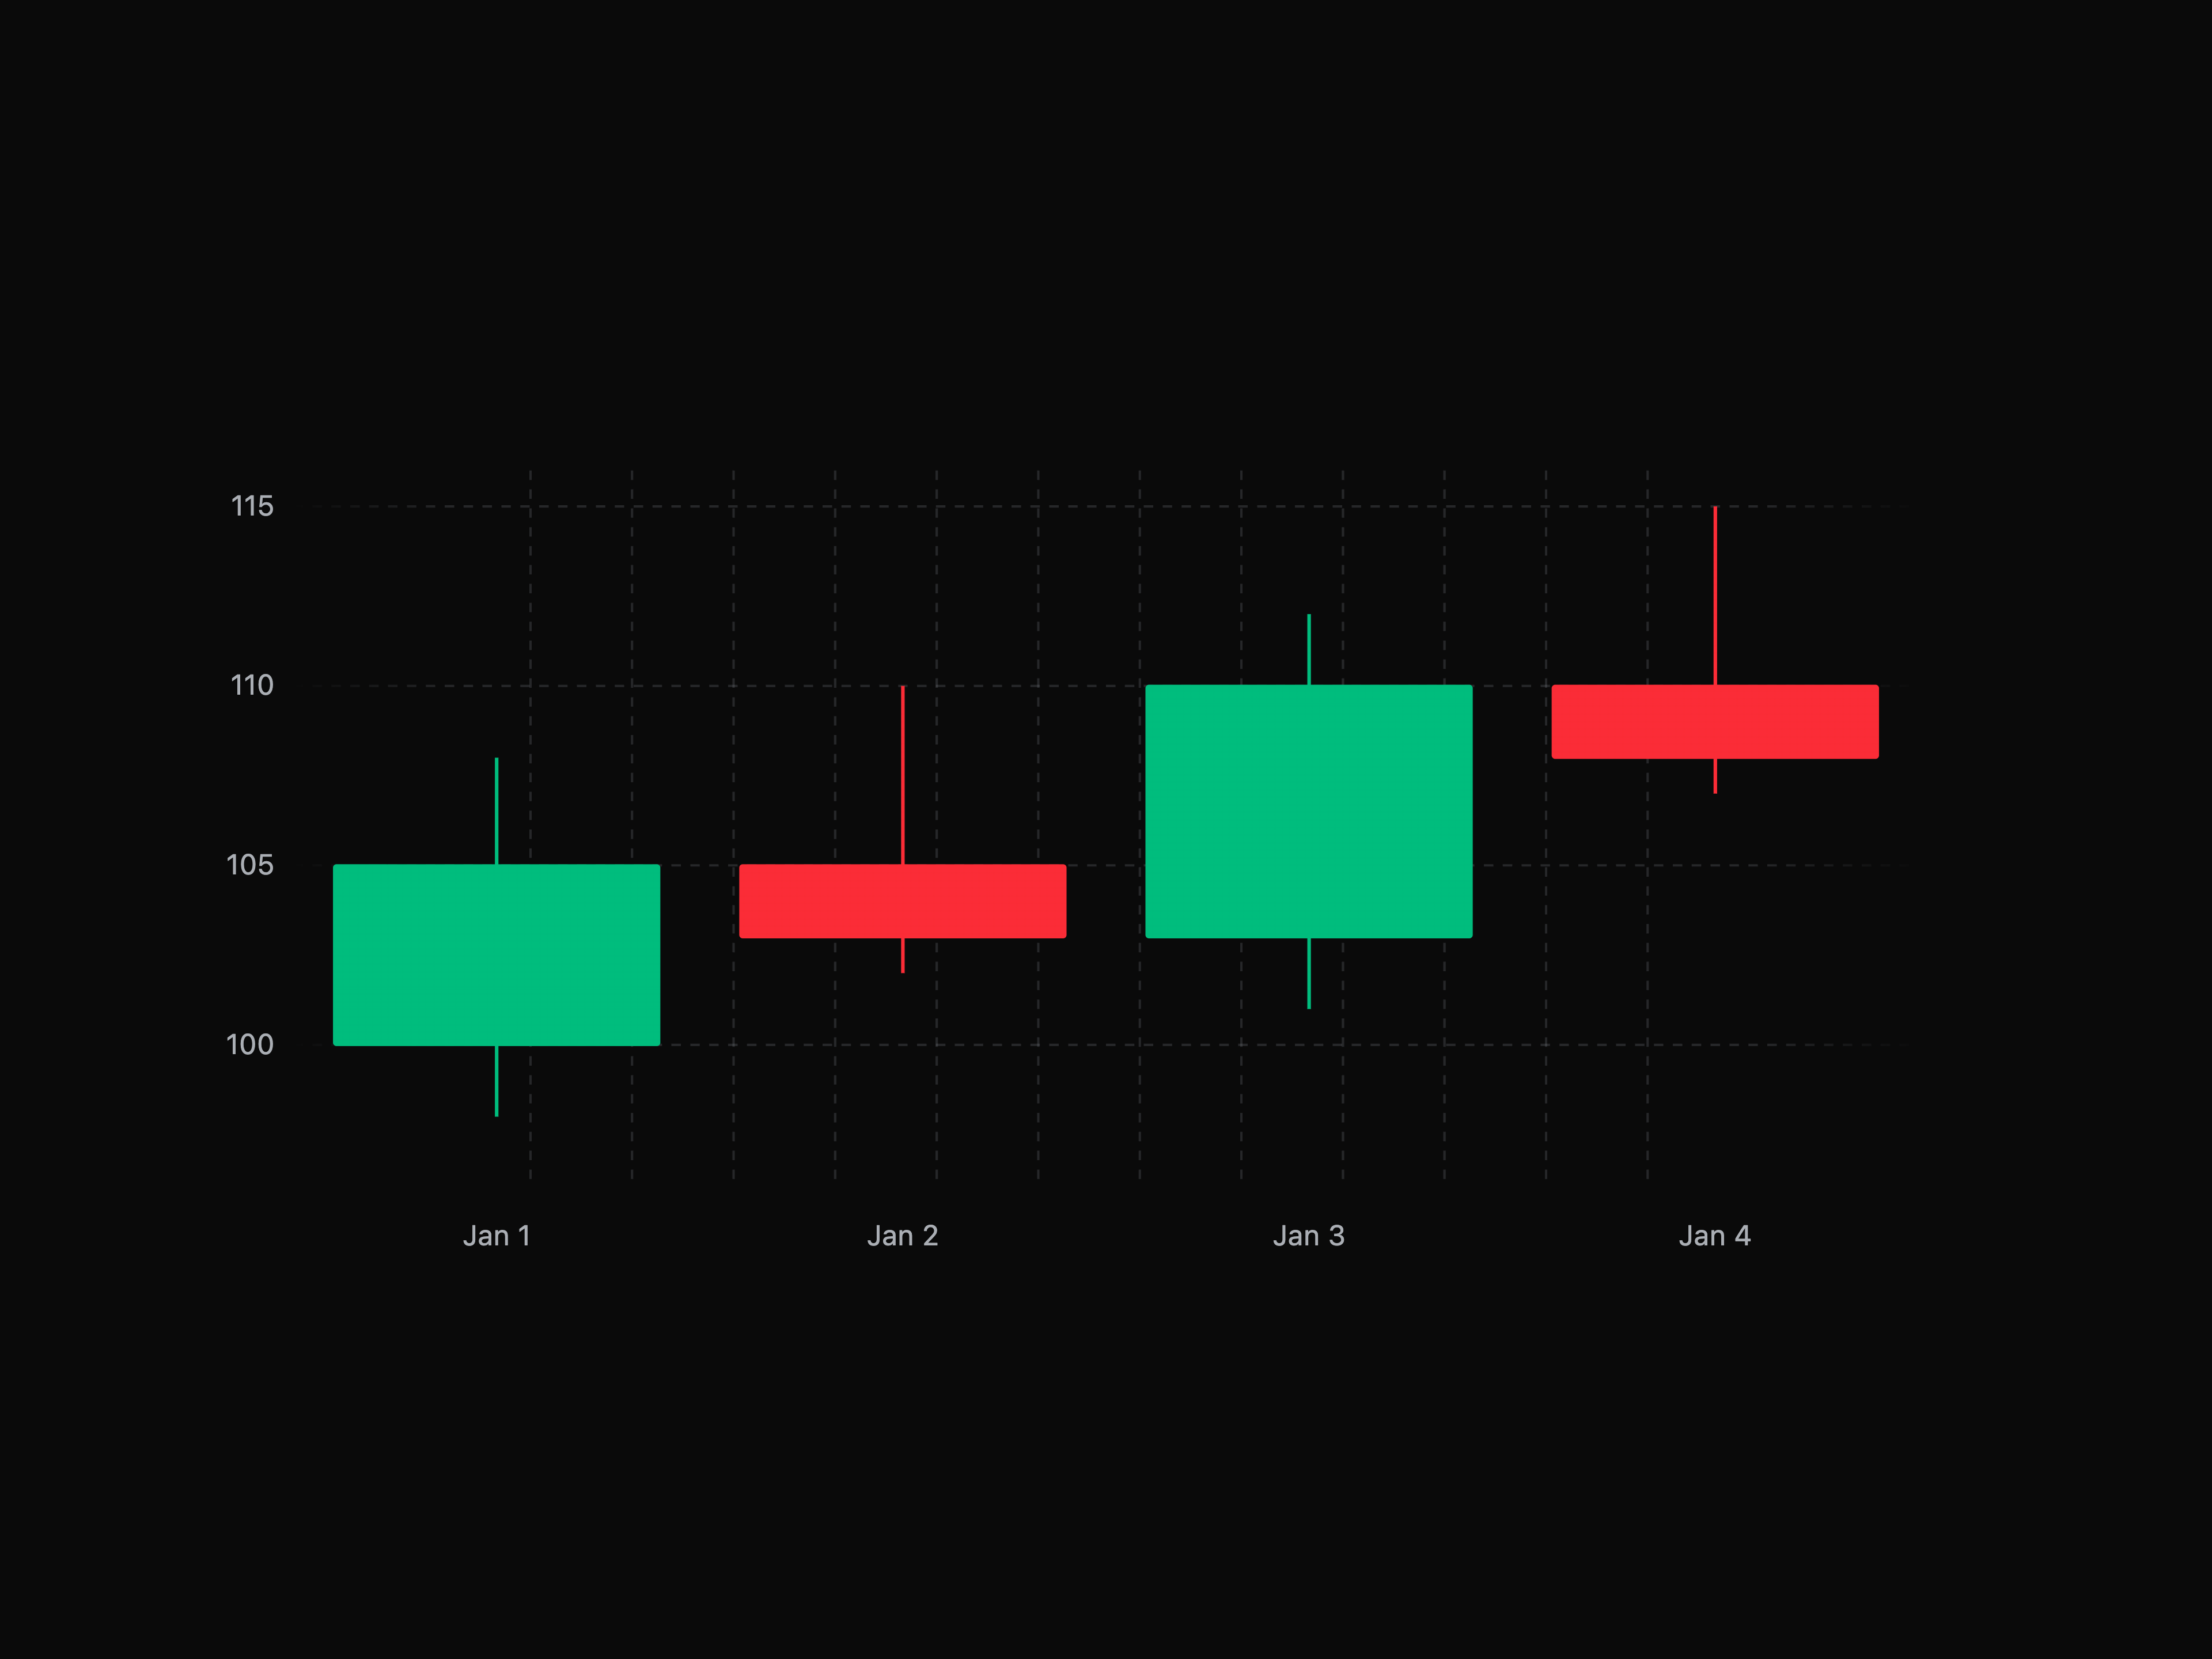
  • Candlestick ChartCandlestick Chart

    Candlestick Chart

  • Funnel Chart

    Funnel Chart

  • Funnel Chart

    Funnel Chart

  • Funnel Chart

    Funnel Chart

  • Funnel Chart

    Funnel Chart

  • Funnel Chart

    Funnel Chart

  • Funnel Chart

    Funnel Chart

  • Funnel Chart

    Funnel Chart

  • Bar Chart

    Bar Chart

  • Bar Chart

    Bar Chart

  • Bar Chart

    Bar Chart

  • Bar Chart

    Bar Chart

  • Bar Chart

    Bar Chart

  • Bar Chart

    Bar Chart

  • Bar Chart

    Bar Chart

  • Bar Chart

    Bar Chart

  • Bar Chart

    Bar Chart

  • Bar Chart

    Bar Chart

  • Area Chart

    Area Chart

  • Area Chart

    Area Chart

  • Area Chart

    Area Chart

  • Area Chart

    Area Chart

  • Area Chart

    Area Chart

  • About Bklit

    Bklit publishes a shadcn registry at ui.bklit.com, with 39 components installable through the shadcn CLI.

    Components
    39
    GitHub stars
    1,809
    Last commit
    Oct 23, 2026
    Repository
    bklit/bklit-ui

    Also in the Bklit registry

    Copy a prompt for your agent, copy the install command, or open the docs that ship it.

    • Chart Background

      background

      Pattern fill for the plot area when grid lines are hidden

      @visx/pattern@4.0.1-alpha.0, motion3 files
      Docs ↗
    • band

    • Bar Depth

      bar-depth

      3D depth and glossy glass surfaces for BarChart bars

      motion1 file
    • Chart Animation

      chart-animation

      Shared motion helpers for chart enter transitions, clip reveals, and staggered animations

      motion7 files
    • Chart Context

      chart-context

      Shared context and hooks for Bklit chart components

      @visx/event@4.0.1-alpha.0, @visx/responsive@4.0.1-alpha.0, @visx/scale@4.0.1-alpha.0, d3-array12 files
    • chart-parent-size

    • Chart Series Layer

      chart-series

      Shared line and area series rendering helpers (paths, markers, highlights, dash tails)

      @visx/shape@4.0.1-alpha.0, d3-shape, motion15 files
    • Chart Stat Flow

      chart-stat-flow

      Animated stat value and label for chart overlays

      @number-flow/react, motion1 file
    • Chart Tooltip

      chart-tooltip

      Composable tooltip components for charts

      @number-flow/react, motion9 files
    • Choropleth Map

      choropleth-chart

      A geographic map chart with zoom, pan, and data visualization

      @types/geojson, @visx/geo@4.0.1-alpha.0, @visx/responsive@4.0.1-alpha.0, @visx/zoom@4.0.1-alpha.07 files2 examples
      Docs ↗
    • Composed Chart

      composed-chart

      Time-series chart composing Line, Area, and SeriesBar on one shared scale (Recharts ComposedChart-style)

      @visx/curve@4.0.1-alpha.0, @visx/scale@4.0.1-alpha.0, @visx/shape@4.0.1-alpha.0, @visx/responsive@4.0.1-alpha.08 files1 example
      Docs ↗
    • deadline

    • Gauge

      gauge-chart

      Notch-based radial or linear gauge with optional center label, patterns, and optional gradients

      @visx/responsive@4.0.1-alpha.0, @visx/pattern@4.0.1-alpha.0, @number-flow/react, motion8 files1 example
      Docs ↗
    • Chart Grid

      grid

      Grid lines for charts

      @visx/grid@4.0.1-alpha.02 files
      Docs ↗
    • Heatmap Chart

      heatmap-chart

      A contribution heatmap with animated cells and configurable level colors

      @visx/group@4.0.1-alpha.0, @visx/heatmap@4.0.1-alpha.0, @visx/pattern@4.0.1-alpha.0, @visx/responsive@4.0.1-alpha.022 files1 example
      Docs ↗
    • Chart Legend

      legend

      Composable legend components for charts

      @base-ui/react, @number-flow/react8 files
      Docs ↗
    • Line Chart

      line-chart

      A composable line chart with multiple series support

      @visx/curve@4.0.1-alpha.0, @visx/shape@4.0.1-alpha.0, motion16 files1 example
      Docs ↗
    • Live Line Chart

      live-line-chart

      Real-time streaming line chart with smooth scrolling, crosshair, and animated axes

      @visx/curve@4.0.1-alpha.0, @visx/scale@4.0.1-alpha.0, @visx/shape@4.0.1-alpha.0, @visx/responsive@4.0.1-alpha.05 files1 example
      Docs ↗
    • Chart Markers

      markers

      Marker components for highlighting data points on charts

      utils3 files
    • patterns

      utils
    • Pie Chart

      pie-chart

      A composable pie chart with animations and customizable slices

      @number-flow/react, @visx/group@4.0.1-alpha.0, @visx/responsive@4.0.1-alpha.0, @visx/shape@4.0.1-alpha.07 files1 example
      Docs ↗
    • Profit/Loss Line

      profit-loss-line

      Sign-colored line segments for profit and loss on LineChart

      @visx/curve@4.0.1-alpha.0, @visx/shape@4.0.1-alpha.04 files
      Docs ↗
    • Projection Line

      projection-line

      Forecast segment extending a line series past the last data point

      @visx/shape@4.0.1-alpha.0, motion4 files
      Docs ↗
    • Radar Chart

      radar-chart

      A composable radar/spider chart with multiple data series

      @visx/group@4.0.1-alpha.0, @visx/responsive@4.0.1-alpha.0, @visx/scale@4.0.1-alpha.0, @visx/shape@4.0.1-alpha.06 files1 example
      Docs ↗
    • Reference Area

      reference-area

      Shaded data-coordinate band for target ranges and thresholds on time-series charts

      motion3 files
      Docs ↗
    • Ring Chart

      ring-chart

      A composable donut/ring chart with progress indicators

      @visx/group@4.0.1-alpha.0, @visx/responsive@4.0.1-alpha.0, @visx/shape@4.0.1-alpha.0, @number-flow/react6 files1 example
      Docs ↗
    • Scatter Chart

      scatter-chart

      A composable time-series scatter chart with offset rings, hover dimming, and animated enter

      d3-array, d3-scale, motion, react-use-measure11 files1 example
      Docs ↗
    • Shimmering Text

      shimmering-text

      Per-character shimmer animation for loading labels and badges

      motion1 file
    • sparkline

      utils3 examples
    • Sunburst Chart

      sunburst-chart

      A composable hierarchical sunburst chart with drill-down zoom and animated segments

      motion9 files1 example
    • trend-line

    • weekends

    • X Axis

      x-axis

      X-axis component for time-series charts

      utils1 file
      Docs ↗
    • Y Axis

      y-axis

      Y-axis component for value labels in line and area charts

      utils2 files
      Docs ↗

    From the Bklit readme

    A collection of Open Source charts and utility components that you can customize and extend.


    Sponsors

    Bklit UI is supported by our sponsors. Become a sponsor.

    Premium sponsors: OpenPanel

    OpenPanel — OpenPanel is an open source analytics platform that combines web analytics and product analytics in one privacy-first tool. Track pageviews, events, funnels, retention, and user journeys — all without cookies.

    Silver sponsors: UI Rules, shadcn studio

    Charts

      Area Chart
      Docs · Studio


      Bar Chart
      Docs · Studio


      Candlestick Chart
      Docs · Studio


      Choropleth Chart
      Docs · Studio


      Composed Chart
      Docs · Studio


      Funnel Chart
      Docs · Studio


      Gauge
      Docs · Studio


      Heatmap Chart
      Docs · Studio


      Line Chart
      Docs · Studio


      Live Line Chart
      Docs · Studio


      Pie Chart
      Docs · Studio


      Profit/Loss Line
      Docs · Studio


      Radar Chart
      Docs · Studio


      Ring Chart
      Docs · Studio


      Sankey Chart
      Docs · Studio


      Scatter Chart
      Docs · Studio


      Sunburst Chart
      Docs · Studio


    Studio

    Studio is Bklit's interactive chart playground. Pick a chart, tweak styling and animation controls in real time, then copy the generated React code or export a registry JSON for your project.

    Open Studio →

    Getting Started

    Bklit UI is a shadcn registry. Initialize shadcn in your project, then add a chart:

    npx shadcn@latest init
    npx shadcn@latest add @bklit/line-chart
    

    See Installation for registry setup and all components.

    Repo activity

    License

    Chart components (packages/ui, shadcn registry) are MIT licensed.

    Bklit Studio (packages/studio, hosted at ui.bklit.com/studio) is proprietary. See LICENSE-STUDIO.md. You may not reuse, resell, or redistribute Studio without written permission.

    Read the rest on GitHub →

    What Bklit builds on

    The packages and primitives its components pull in, counted across the registry.

    utils27chart-utils6badge3card3

    What Bklit shipped recently

    Every appearance and removal our crawl has seen in the registry index.

    • sparklineaddedOct 24, 2026
    • sparkline-exampleaddedOct 24, 2026
    • deadlineaddedOct 22, 2026
    • weekendsaddedOct 22, 2026
    • bandaddedOct 20, 2026
    • trend-lineaddedOct 20, 2026
    • chart-parent-sizeaddedOct 14, 2026
    • patternsaddedOct 14, 2026

    Registries like Bklit

    Evil Charts

    Evil Charts

    by Legion Dev

    13

    components

    Pace UI

    Pace UI

    by Pace UI

    12

    components

    Browse every shadcn registry we track →

    1. Components
    2. /
    3. bklitai
    4. /
    5. Bklit

    Related libraries

    FR

    Freedom

    by Dhileep Kumar GM

    215

    components

    Efferd

    Efferd

    by Efferd

    114

    components

    Agent Elements

    Agent Elements

    by 21st

    22

    components

    vizcn · by vibecoding.tech

    vizcn · by vibecoding.tech

    by Eugene Shilow

    17

    components

    visx

    visx

    by Airbnb

    29

    components

    Aceternity UI

    Aceternity UI

    by Manu Arora

    89

    components

    About Bklit

    Bklit is a component library on 21st.dev by bklitai with 5 public React components. Every component ships with a live interactive preview and full TSX source — copy the code, install it through the shadcn CLI, or pull it into Cursor or Claude Code over MCP.

    All 5 Bklit components

    • Area Chart
    • Bar Chart
    • Candlestick Chart
    • Funnel Chart
    • Sankey Diagram

    Browse all component libraries →