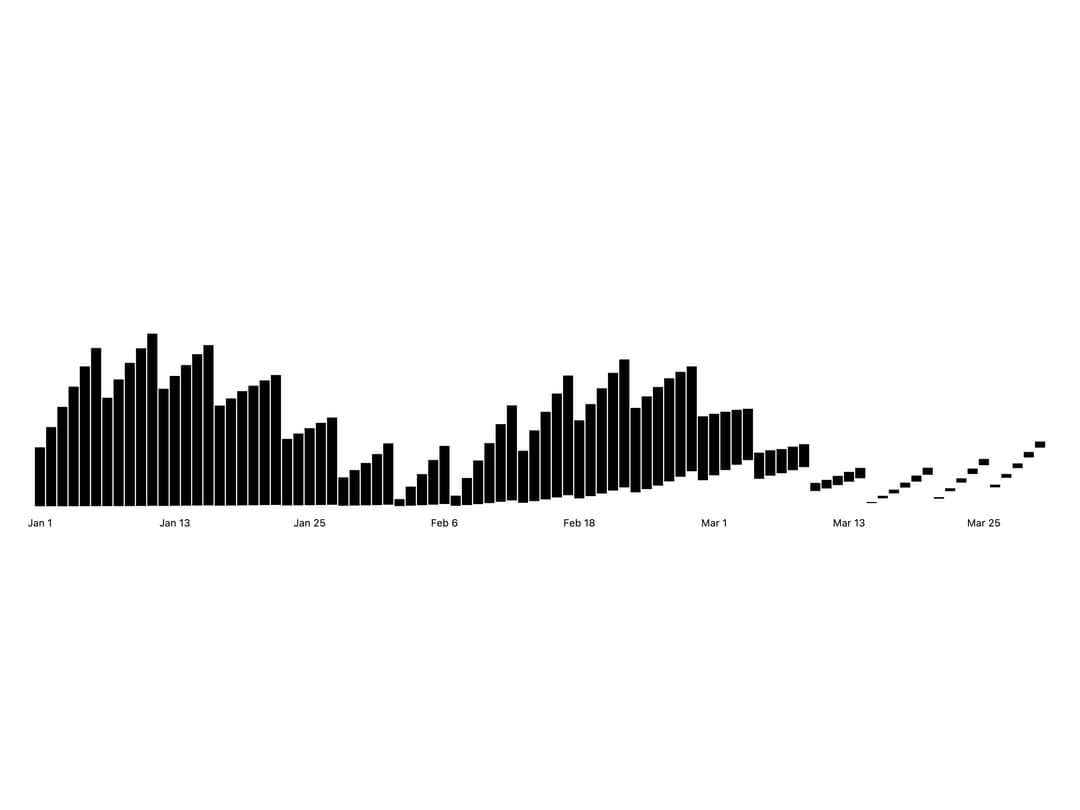
About
Here is Bar Chart component
Built with React and Tailwind. Copy the prompt and paste it into Claude Code, Cursor or Lovable: your agent adds Bar Chart to your project and fits it to your theme.
Code
How Bar Chart is used: the demo's code. The component's own source comes with a free account.
Usage.tsx
"use client";

import {
  BarChart,
  Bar,
  BarXAxis,
  Grid,
  ChartTooltip,
} from "@/components/ui/bar-chart";

const dailyData = Array.from({ length: 90 }, (_, i) => {
  const date = new Date(2024, 0, 1);
  date.setDate(date.getDate() + i);
  return {
    day: date.toLocaleDateString("en-US", { month: "short", day: "numeric" }),
    value: Math.floor(50 + Math.sin(i / 7) * 30 + ((i * 7) % 37) - 18),
  };
});

export default function BarChartDemo90Days() {
  return (
    <div className="w-full">
      <BarChart
        data={dailyData}
        xDataKey="day"
        barGap={0.1}
        aspectRatio="4 / 1"
      >
        <Grid horizontal />
        <Bar dataKey="value" lineCap="butt" />
        <BarXAxis maxLabels={8} />
        <ChartTooltip />
      </BarChart>
    </div>
  );
}
Dependencies
More by bklitai
View all

Funnel Chart
398
Area Chart
356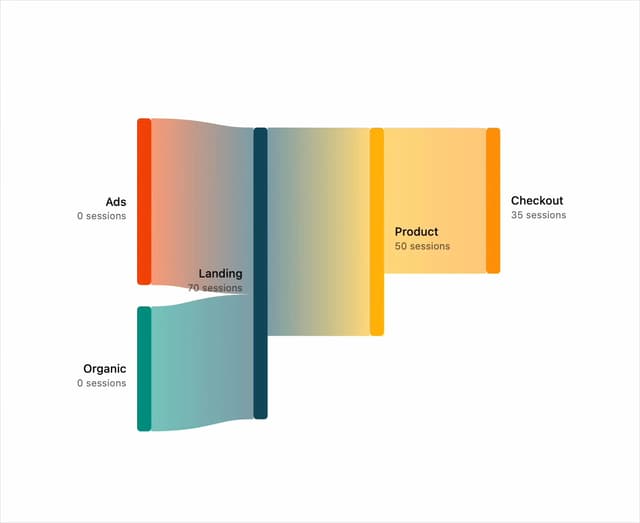
Sankey Diagram
29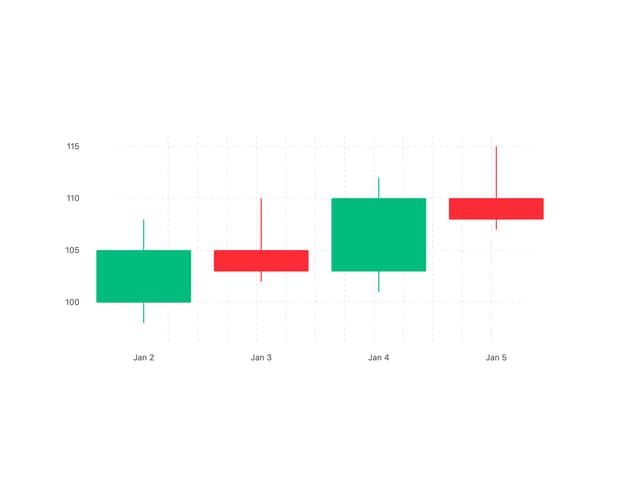
Candlestick Chart
10