About
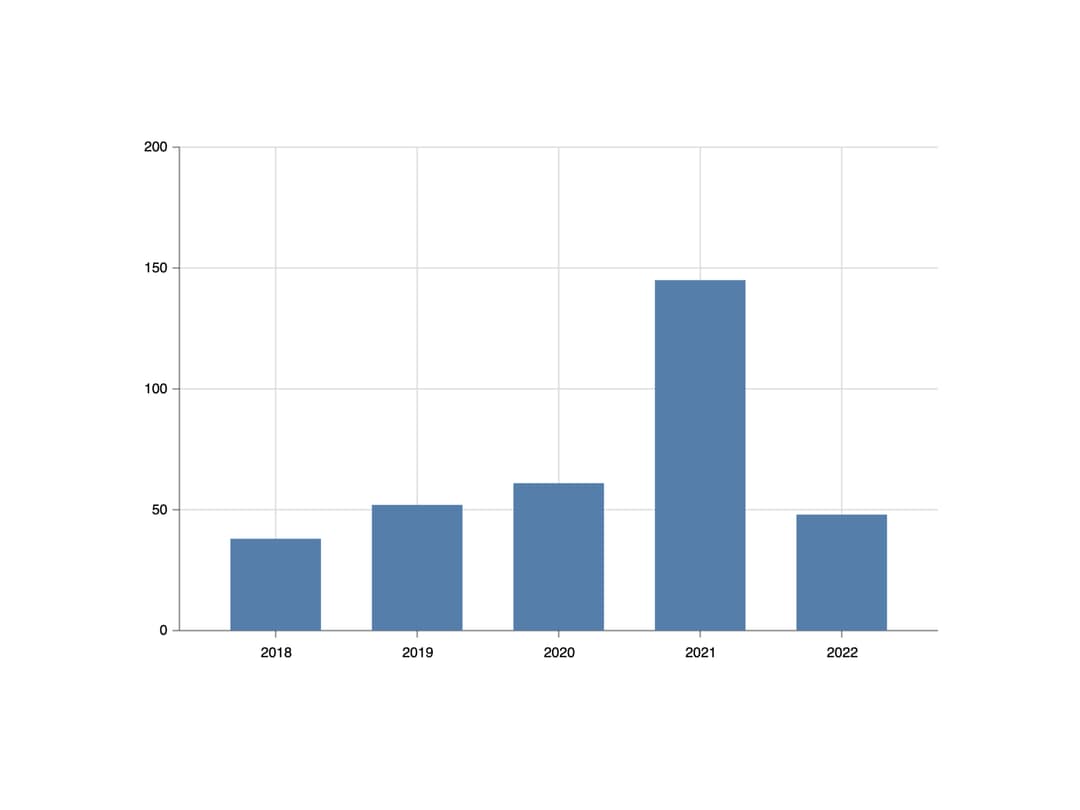
A vertical column chart component for comparing categorical data, with optional grouping and stacking, built on @antv/gpt-vis.
Built with React and Tailwind. Copy the prompt and paste it into Claude Code, Cursor or Lovable: your agent adds Column Chart to your project and fits it to your theme.
Code
How Column Chart is used: the demo's code. The component's own source comes with a free account.
Usage.tsx
import { Column } from "@/components/ui/column";

export default function Default() {
  return (
    <div className="inline-block bg-background p-4 text-foreground">
      <Column
        config={{
          data: [
            { category: "2018", value: 38 },
            { category: "2019", value: 52 },
            { category: "2020", value: 61 },
            { category: "2021", value: 145 },
            { category: "2022", value: 48 },
          ],
          xField: "category",
          yField: "value",
        }}
        theme="academy"
        width={600}
        height={400}
        className="w-auto min-h-0"
      />
    </div>
  );
}
Dependencies
More by gpt-vis
View all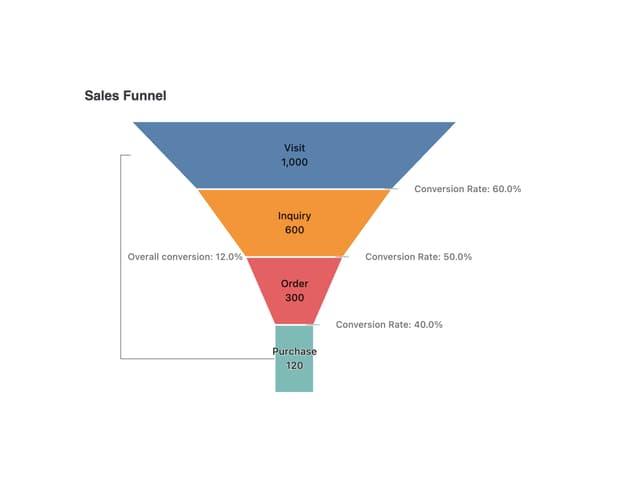

Funnel Chart
20
GPT-Vis
8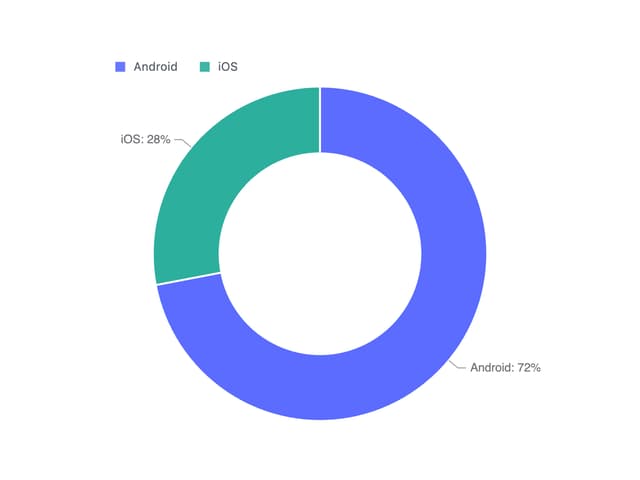
Pie Chart