About
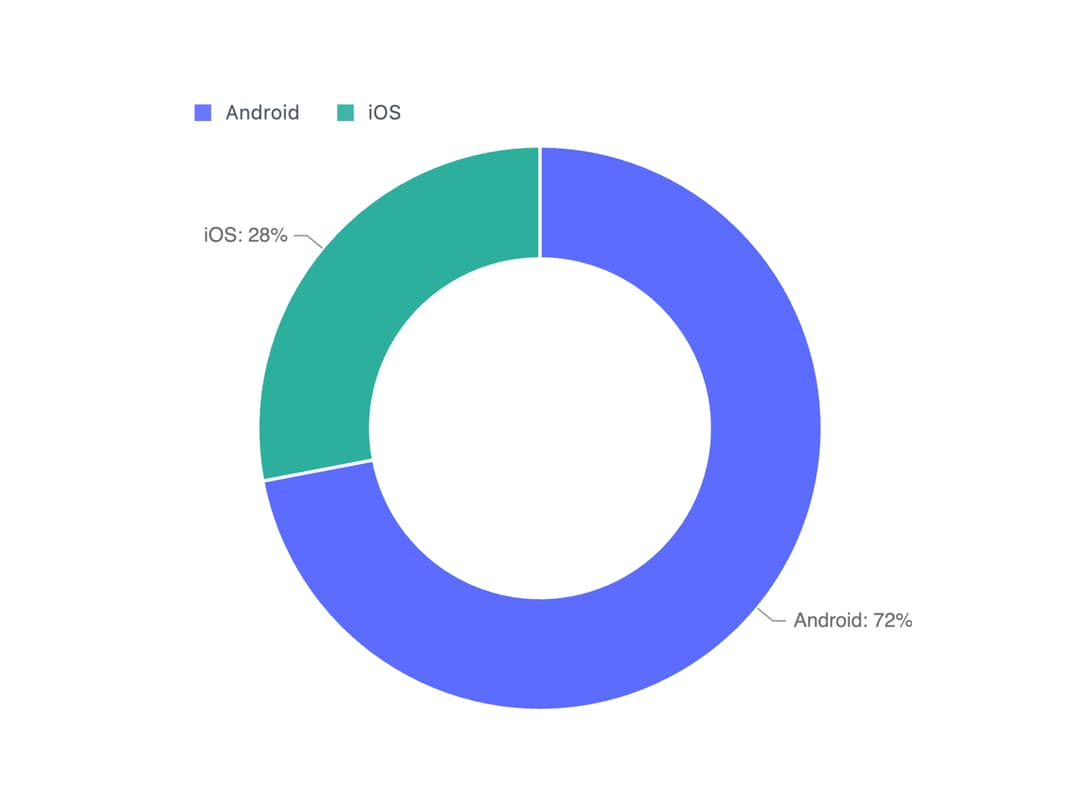
A pie chart component for visualizing proportions of parts as slices, with optional donut style, powered by AntV GPT-Vis.
Built with React and Tailwind. Copy the prompt and paste it into Claude Code, Cursor or Lovable: your agent adds Pie Chart to your project and fits it to your theme.
Code
How Pie Chart is used: the demo's code. The component's own source comes with a free account.
Usage.tsx
import { Pie } from "@/components/ui/pie";

export default function PieDemo() {
  return (
    <div className="w-full max-w-md mx-auto">
      <Pie
        config={{
          data: [
            { category: "Android", value: 72 },
            { category: "iOS", value: 28 },
          ],
          innerRadius: 0.6,
        }}
        height={400}
      />
    </div>
  );
}
Dependencies
More by gpt-vis
View all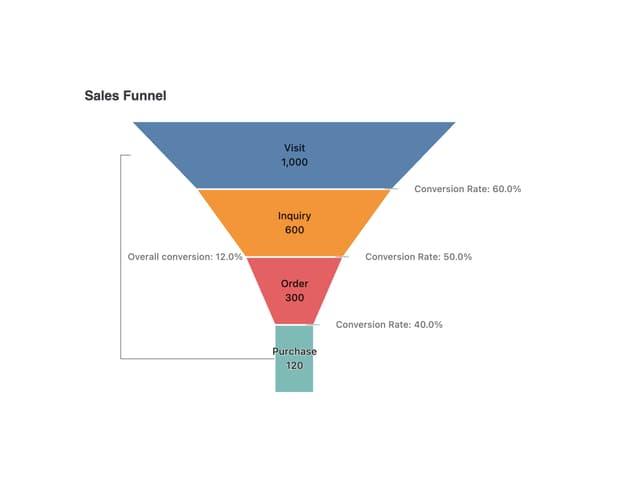

Funnel Chart
20
GPT-Vis
8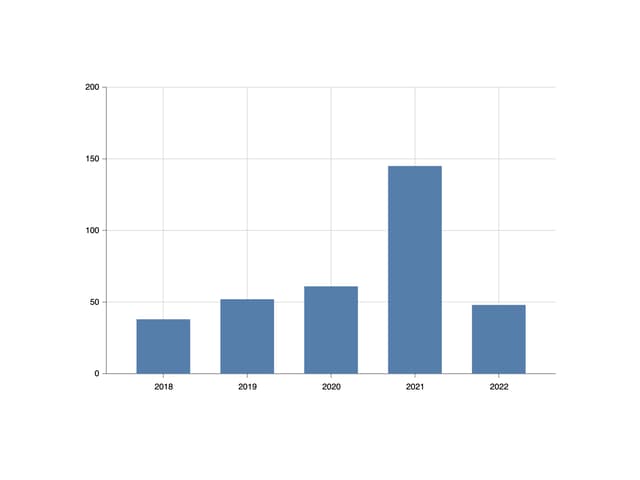
Column Chart