About
A React chart component that renders AI/LLM-generated data visualizations from vis-syntax strings or config objects, supporting 26 chart types via @antv/gpt-vis.
Built with React and Tailwind. Copy the prompt and paste it into Claude Code, Cursor or Lovable: your agent adds GPT-Vis to your project and fits it to your theme.
Code
How GPT-Vis is used: the demo's code. The component's own source comes with a free account.
Usage.tsx
import { GPTVis } from "@/components/ui/gpt-vis";

export default function Default() {
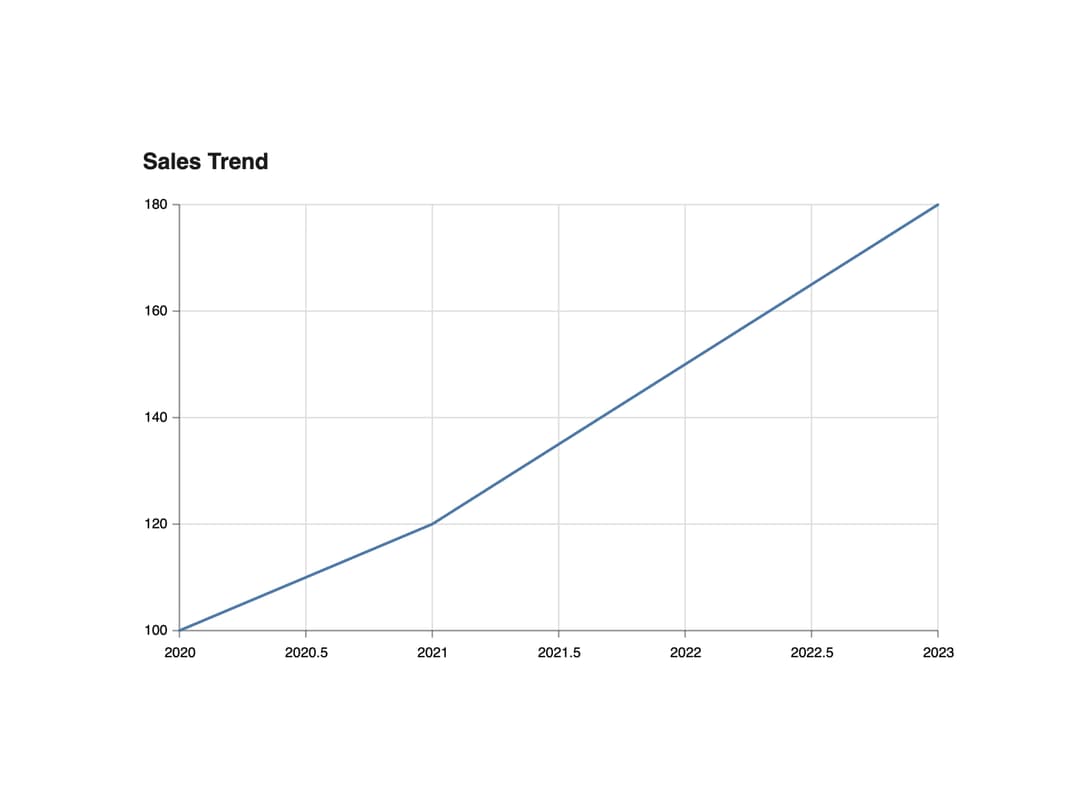
  const visSyntax = `vis line
data
  - time 2020
    value 100
  - time 2021
    value 120
  - time 2022
    value 150
  - time 2023
    value 180
title Sales Trend`;

  return (
    <div className="inline-block bg-background p-4 text-foreground">
      <GPTVis
        content={visSyntax}
        theme="academy"
        width={600}
        height={400}
        className="w-auto min-h-0"
      />
    </div>
  );
}
Dependencies
More by gpt-vis
View all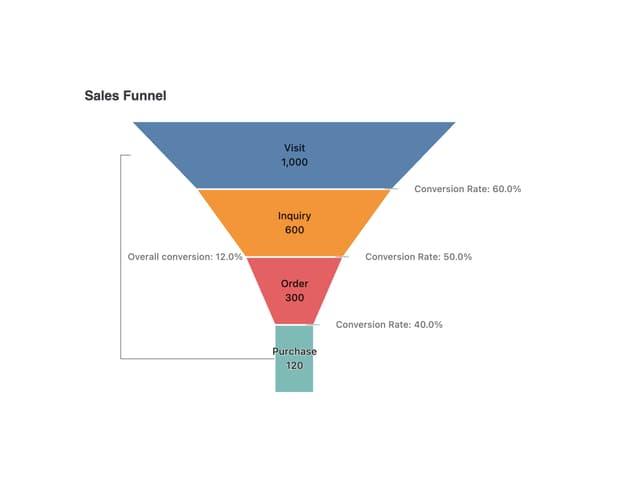

Funnel Chart
20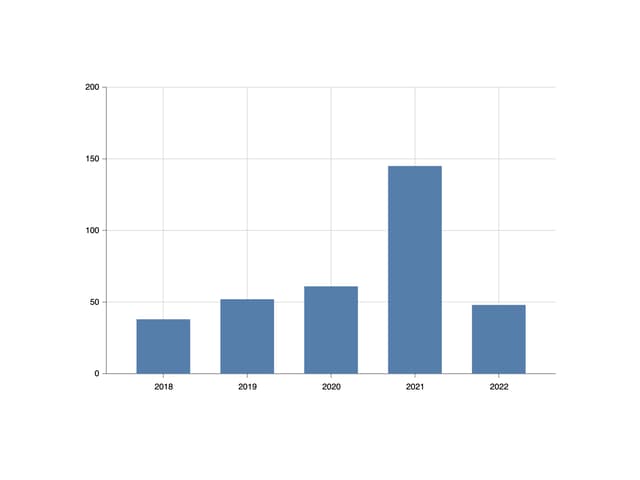
Column Chart
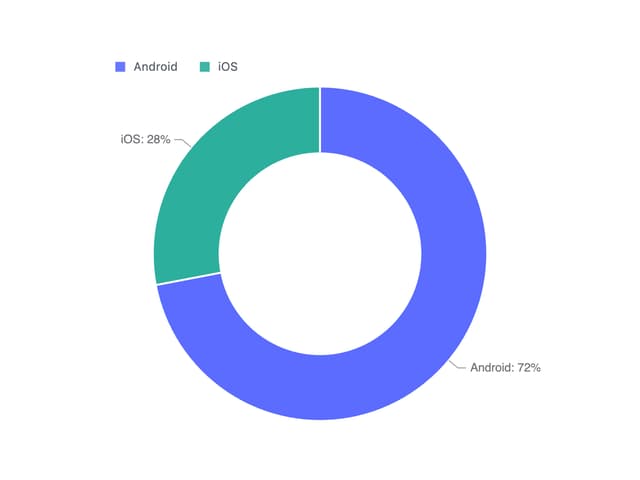
Pie Chart
More in AI chats
View all

AI Actions
319
Agent Chat
17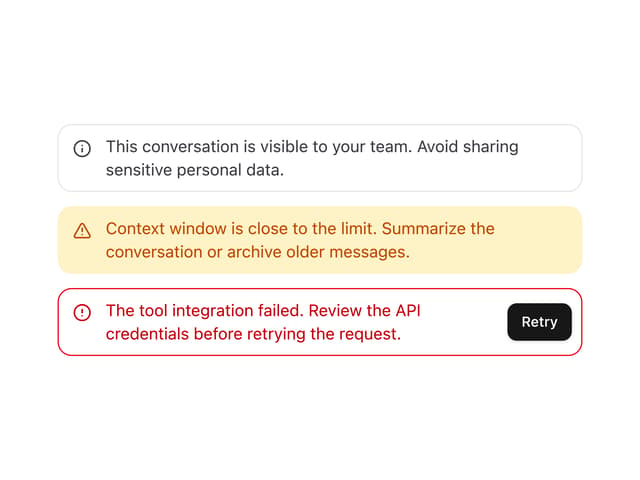

System Message
54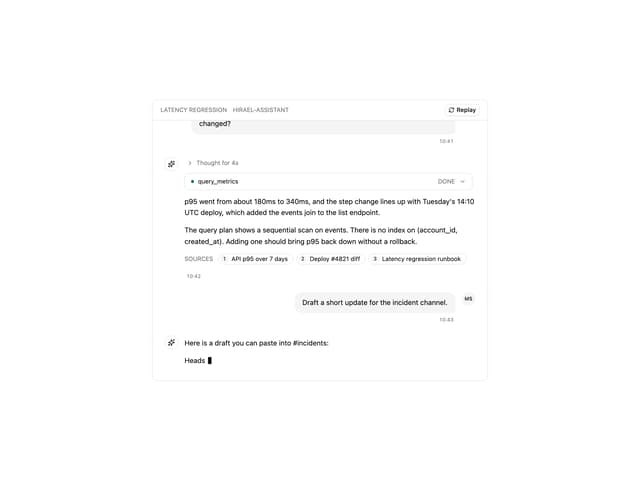
Message Thread
35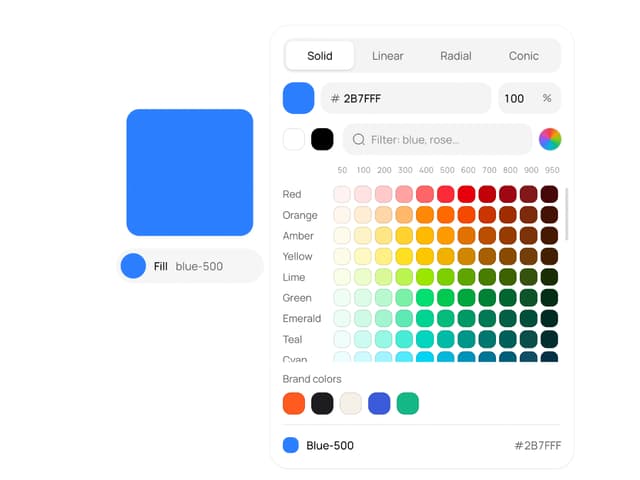
Color Picker
81

AI Task List
160

Modal Card
101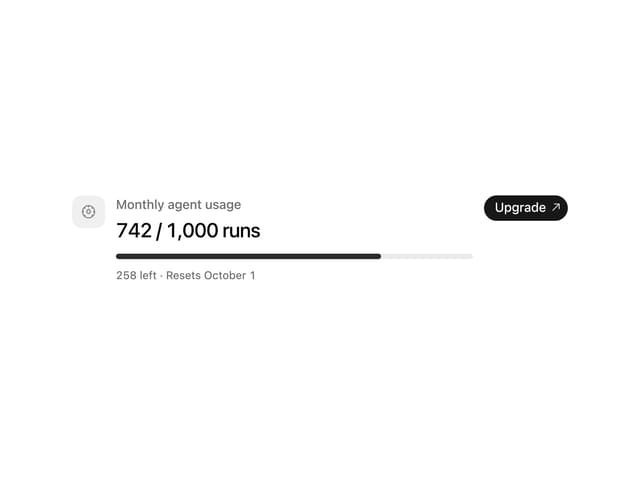
Quota Banner
21


