About
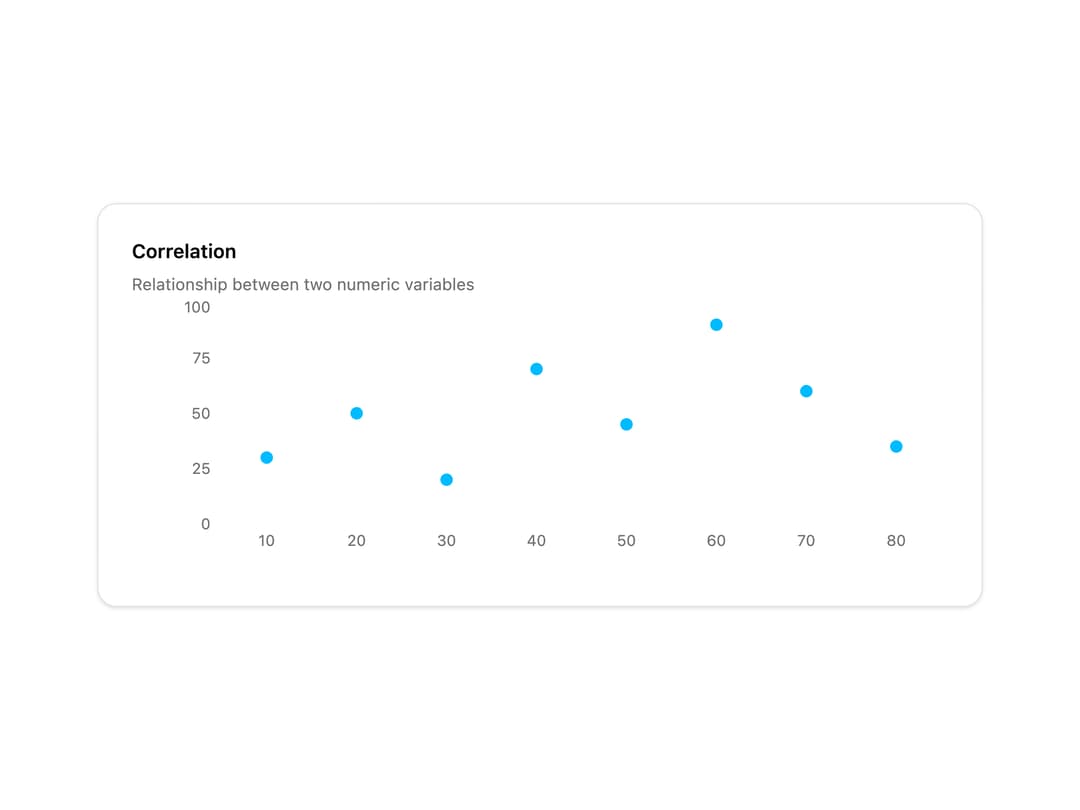
A scatter chart card for visualizing correlation between two numeric variables using recharts.
Built with React and Tailwind. Copy the prompt and paste it into Claude Code, Cursor or Lovable: your agent adds Scatter Chart to your project and fits it to your theme.
Code
How Scatter Chart is used: the demo's code. The component's own source comes with a free account.
Usage.tsx
import ScatterChart from "@/components/ui/scatter-chart";

const data = [
  { x: 10, y: 30 },
  { x: 20, y: 50 },
  { x: 30, y: 20 },
  { x: 40, y: 70 },
  { x: 50, y: 45 },
  { x: 60, y: 90 },
  { x: 70, y: 60 },
  { x: 80, y: 35 },
];

export default function ScatterChartDemo() {
  return (
    <ScatterChart
      data={data}
      xKey="x"
      yKey="y"
      title="Correlation"
      description="Relationship between two numeric variables"
    />
  );
}
Dependencies
More by heygaia
View all

Tool Calls Section
401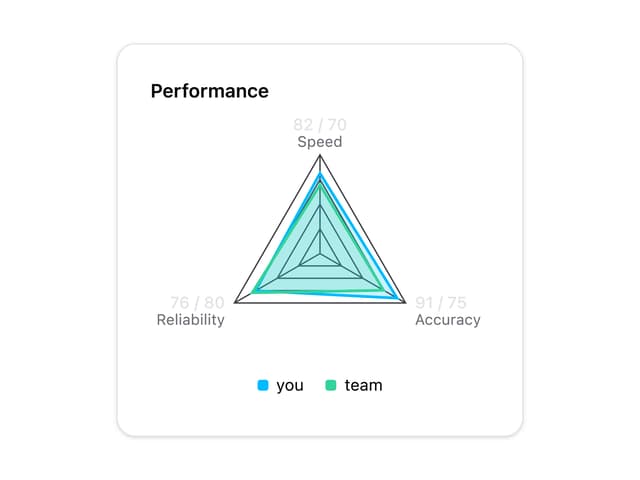
Radar Chart
47
Wave Spinner
21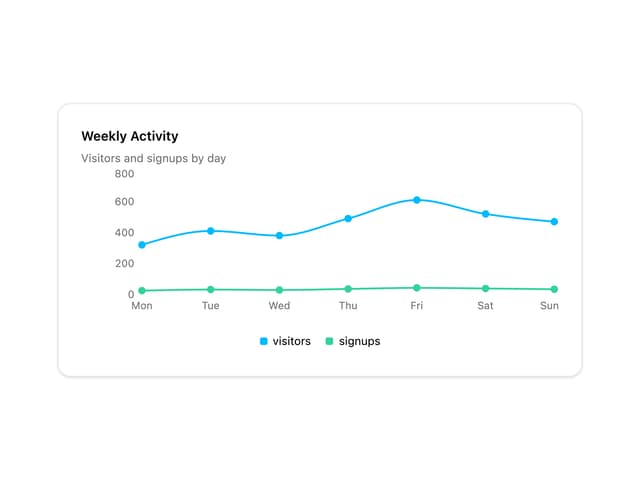
Line Chart
12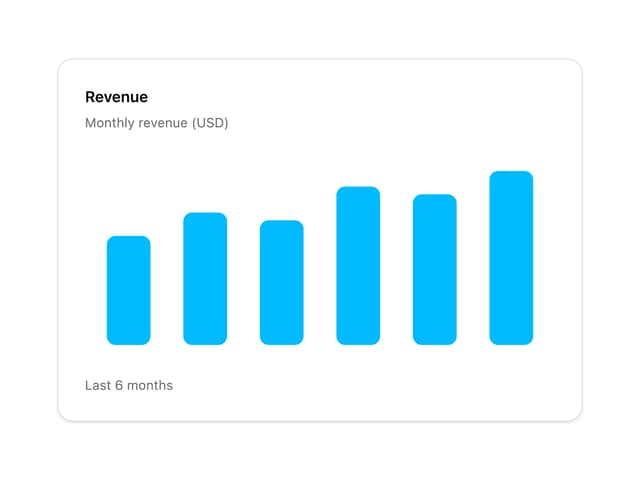
Bar Chart
12
Knowledge Graph
6
Pie Chart
6
Pricing Card