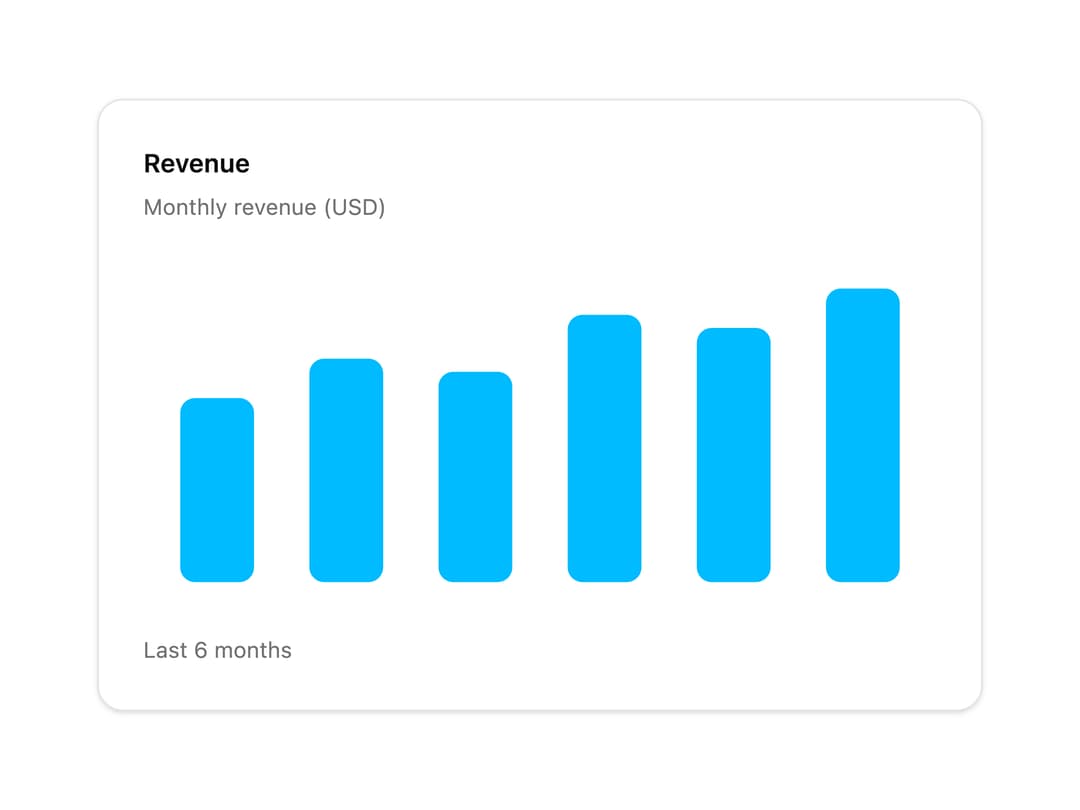
About
A bar chart component for comparing values or showing distributions, with default, stacked, horizontal, and multi-series variants built on Recharts and shadcn chart primitives.
Built with React and Tailwind. Copy the prompt and paste it into Claude Code, Cursor or Lovable: your agent adds Bar Chart to your project and fits it to your theme.
Code
How Bar Chart is used: the demo's code. The component's own source comes with a free account.
Usage.tsx
import { BarChart } from "@/components/ui/bar-chart";

const data = [
  { month: "Jan", revenue: 4200 },
  { month: "Feb", revenue: 5100 },
  { month: "Mar", revenue: 4800 },
  { month: "Apr", revenue: 6100 },
  { month: "May", revenue: 5800 },
  { month: "Jun", revenue: 6700 },
];

export default function Example() {
  return (
    <div className="flex w-full items-center justify-center p-8">
      <BarChart
        data={data}
        xKey="month"
        yKeys="revenue"
        title="Revenue"
        description="Monthly revenue (USD)"
        footer="Last 6 months"
      />
    </div>
  );
}
Dependencies
More by heygaia
View all

Tool Calls Section
401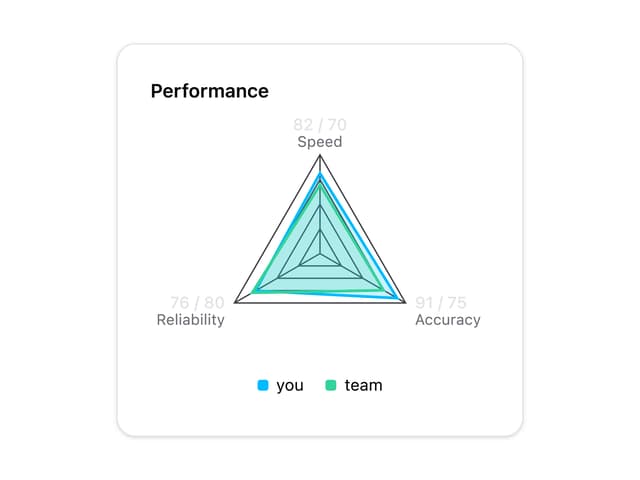
Radar Chart
47
Wave Spinner
21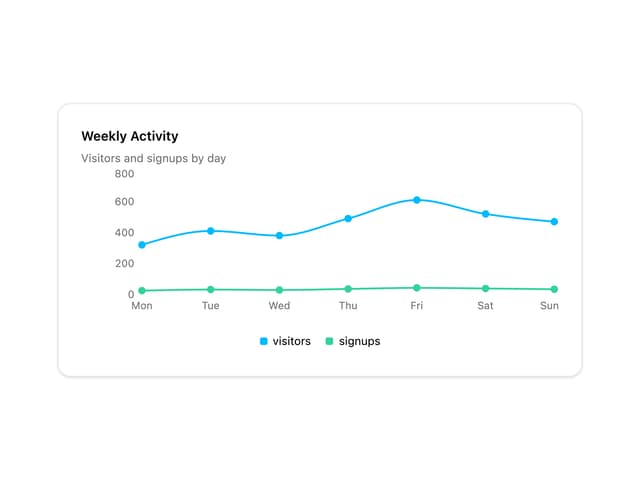
Line Chart
12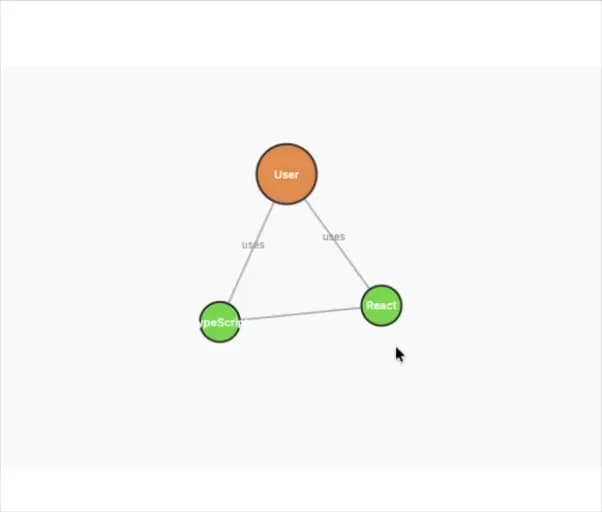
Knowledge Graph
6
Pie Chart
6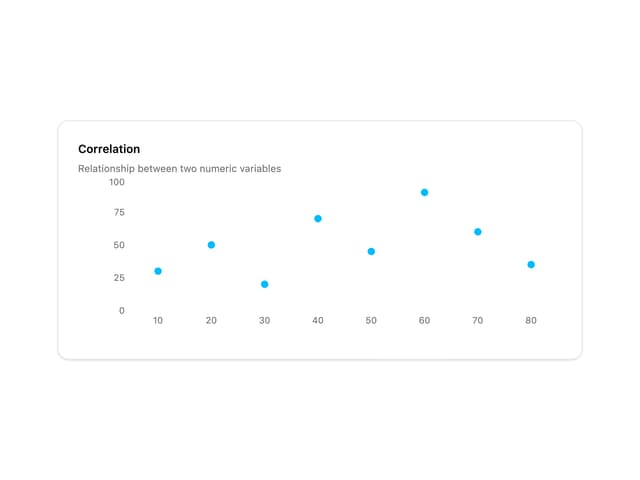
Scatter Chart
5
Pricing Card
More in Dashboards
View all
Dashboard with Collapsible Sidebar
2.4K

Sidebar
234

SaaS Template
2.4K

Chat template
598
Stats Bento
1.1K

Financial Bento Grid
71

Statistics Card 2
264

Course Design Cards
1.1K

