
About
Composable chart primitives built on Recharts with theme-aware colors, tooltips, and legends.
Built with React and Tailwind. Copy the prompt and paste it into Claude Code, Cursor or Lovable: your agent adds Chart to your project and fits it to your theme.
Code
How Chart is used: the demo's code. The component's own source comes with a free account.
Usage.tsx
"use client"

import { Bar, BarChart, CartesianGrid, XAxis } from "recharts"

import {
  ChartConfig,
  ChartContainer,
  ChartLegend,
  ChartLegendContent,
  ChartTooltip,
  ChartTooltipContent,
} from "@/components/ui/interfaces-chart"

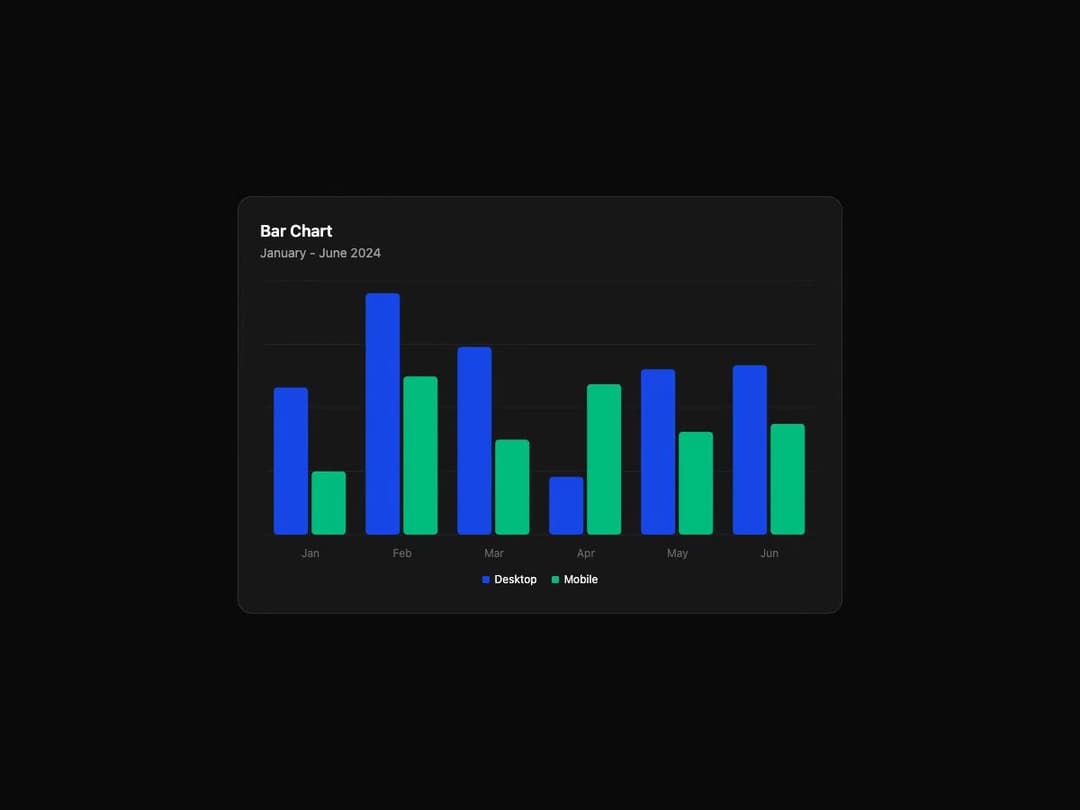
const chartData = [
  { month: "January", desktop: 186, mobile: 80 },
  { month: "February", desktop: 305, mobile: 200 },
  { month: "March", desktop: 237, mobile: 120 },
  { month: "April", desktop: 73, mobile: 190 },
  { month: "May", desktop: 209, mobile: 130 },
  { month: "June", desktop: 214, mobile: 140 },
]

const chartConfig = {
  desktop: { label: "Desktop", color: "var(--chart-1)" },
  mobile: { label: "Mobile", color: "var(--chart-2)" },
} satisfies ChartConfig

export default function ChartBarDemo() {
  return (
    <div className="flex w-full min-h-screen items-center justify-center overflow-hidden bg-background p-8">
      <div className="w-full max-w-2xl rounded-2xl border bg-card p-6 shadow-sm">
        <div className="mb-4">
          <h3 className="text-lg font-semibold text-foreground">Bar Chart</h3>
          <p className="text-sm text-muted-foreground">January - June 2024</p>
        </div>
        <ChartContainer config={chartConfig} className="min-h-[200px] w-full">
          <BarChart accessibilityLayer data={chartData}>
            <CartesianGrid vertical={false} />
            <XAxis
              dataKey="month"
              tickLine={false}
              tickMargin={10}
              axisLine={false}
              tickFormatter={(value) => value.slice(0, 3)}
            />
            <ChartTooltip content={<ChartTooltipContent />} />
            <ChartLegend content={<ChartLegendContent />} />
            <Bar dataKey="desktop" fill="var(--color-desktop)" radius={4} />
            <Bar dataKey="mobile" fill="var(--color-mobile)" radius={4} />
          </BarChart>
        </ChartContainer>
      </div>
    </div>
  )
}
Dependencies
More by jshguo
View all

Progress
426
Select
369
Textarea
258
Input OTP
160
Interfaces Carousel
160
Switch
136
Hover Card
109
Card
85
More in Cards
View all
Stats cards with links
33

Course Design Cards
1.1K

Card
70
Statistics Card 2
264
Statistics Card 10
263

Card
17

Card Studio
9
The Item one
3
