
About
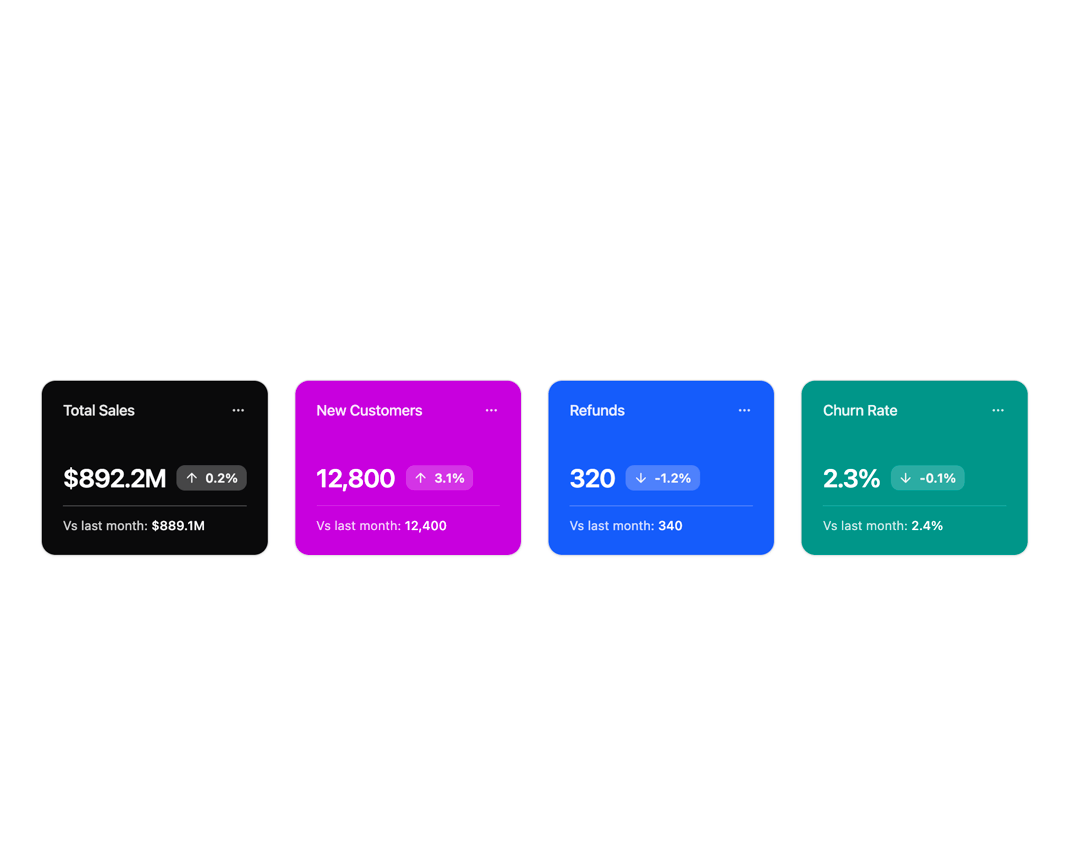
Statistics Card is designed to present key metrics and insights featuring unique layouts, data visualizations, and styling options. Perfect for dashboards, admin panels, and analytics pages.
Built with React and Tailwind. Copy the prompt and paste it into Claude Code, Cursor or Lovable: your agent adds Statistics Card 2 to your project and fits it to your theme.
Code
How Statistics Card 2 is used: the demo's code. The component's own source comes with a free account.
Usage.tsx
import { Badge } from '@/components/ui/badge-2';
import { Button } from '@/components/ui/button-1';
import { Card, CardContent, CardHeader, CardTitle, CardToolbar } from '@/components/ui/card';
import {
  DropdownMenu,
  DropdownMenuContent,
  DropdownMenuItem,
  DropdownMenuSeparator,
  DropdownMenuTrigger,
} from '@/components/ui/dropdown-menu';
import { ArrowDown, ArrowUp, MoreHorizontal, Pin, Settings, Share2, Trash, TriangleAlert } from 'lucide-react';

const stats = [
  {
    title: 'Total Sales',
    value: 892200000,
    delta: 0.2,
    lastMonth: 889100000,
    positive: true,
    prefix: '$',
    suffix: 'M',
    format: (v: number) => `$${(v / 1_000_000).toFixed(1)}M`,
    lastFormat: (v: number) => `$${(v / 1_000_000).toFixed(1)}M`,
    bg: 'bg-zinc-950',
    svg: (
      <svg
        className="absolute right-0 top-0 h-full w-2/3 pointer-events-none"
        viewBox="0 0 300 200"
        fill="none"
        style={{ zIndex: 0 }}
      >
        <circle cx="220" cy="100" r="90" fill="#fff" fillOpacity="0.08" />
        <circle cx="260" cy="60" r="60" fill="#fff" fillOpacity="0.10" />
        <circle cx="200" cy="160" r="50" fill="#fff" fillOpacity="0.07" />
        <circle cx="270" cy="150" r="30" fill="#fff" fillOpacity="0.12" />
      </svg>
    ),
  },
  {
    title: 'New Customers',
    value: 12800,
    delta: 3.1,
    lastMonth: 12400,
    positive: true,
    prefix: '',
    suffix: '',
    bg: 'bg-fuchsia-600',
    svg: (
      <svg
        className="absolute right-0 top-0 w-48 h-48 pointer-events-none"
        viewBox="0 0 200 200"
        fill="none"
        style={{ zIndex: 0 }}
      >
        <defs>
          <filter id="blur2" x="-20%" y="-20%" width="140%" height="140%">
            <feGaussianBlur stdDeviation="10" />
          </filter>
        </defs>
        <ellipse cx="170" cy="60" rx="40" ry="18" fill="#fff" fillOpacity="0.13" filter="url(#blur2)" />
        <rect x="120" y="20" width="60" height="20" rx="8" fill="#fff" fillOpacity="0.10" />
        <polygon points="150,0 200,0 200,50" fill="#fff" fillOpacity="0.07" />
        <circle cx="180" cy="100" r="14" fill="#fff" fillOpacity="0.16" />
      </svg>
    ),
  },
  {
    title: 'Refunds',
    value: 320,
    delta: -1.2,
    lastMonth: 340,
    positive: false,
    prefix: '',
    suffix: '',
    bg: 'bg-blue-600',
    svg: (
      <svg
        className="absolute right-0 top-0 w-48 h-48 pointer-events-none"
        viewBox="0 0 200 200"
        fill="none"
        style={{ zIndex: 0 }}
      >
        <defs>
          <filter id="blur3" x="-20%" y="-20%" width="140%" height="140%">
            <feGaussianBlur stdDeviation="12" />
          </filter>
        </defs>
        <rect x="120" y="0" width="70" height="70" rx="35" fill="#fff" fillOpacity="0.09" filter="url(#blur3)" />
        <ellipse cx="170" cy="80" rx="28" ry="12" fill="#fff" fillOpacity="0.12" />
        <polygon points="200,0 200,60 140,0" fill="#fff" fillOpacity="0.07" />
        <circle cx="150" cy="30" r="10" fill="#fff" fillOpacity="0.15" />
      </svg>
    ),
  },
  {
    title: 'Churn Rate',
    value: 2.3,
    delta: -0.1,
    lastMonth: 2.4,
    positive: false,
    prefix: '',
    suffix: '%',
    bg: 'bg-teal-600',
    svg: (
      <svg
        className="absolute right-0 top-0 w-48 h-48 pointer-events-none"
        viewBox="0 0 200 200"
        fill="none"
        style={{ zIndex: 0 }}
      >
        <defs>
          <filter id="blur4" x="-20%" y="-20%" width="140%" height="140%">
            <feGaussianBlur stdDeviation="16" />
          </filter>
        </defs>
        <polygon points="200,0 200,100 100,0" fill="#fff" fillOpacity="0.09" />
        <ellipse cx="170" cy="40" rx="30" ry="18" fill="#fff" fillOpacity="0.13" filter="url(#blur4)" />
        <rect x="140" y="60" width="40" height="18" rx="8" fill="#fff" fillOpacity="0.10" />
        <circle cx="150" cy="30" r="14" fill="#fff" fillOpacity="0.18" />
        <line x1="120" y1="0" x2="200" y2="80" stroke="#fff" strokeOpacity="0.08" strokeWidth="6" />
      </svg>
    ),
  },
];

function formatNumber(n: number) {
  if (n >= 1_000_000) return (n / 1_000_000).toFixed(1) + 'M';
  if (n >= 1_000) return n.toLocaleString();
  return n.toString();
}

export default function StatisticCard2() {
  return (
    <div className="min-h-screen flex items-center justify-center p-6 lg:p-8">
      <div className="grow grid grid-cols-1 sm:grid-cols-2 lg:grid-cols-4 gap-6">
        {stats.map((stat, index) => (
          <Card key={index} className={`relative overflow-hidden ${stat.bg} text-white`}>
            <CardHeader className="border-0 z-10 relative">
              <CardTitle className="text-white/90 text-sm font-medium">{stat.title}</CardTitle>
              <CardToolbar>
                <DropdownMenu>
                  <DropdownMenuTrigger asChild>
                    <Button variant="dim" size="sm" mode="icon" className="-me-1.5 text-white/80 hover:text-white">
                      <MoreHorizontal />
                    </Button>
                  </DropdownMenuTrigger>
                  <DropdownMenuContent align="end" side="bottom">
                    <DropdownMenuItem>
                      <Settings /> Settings
                    </DropdownMenuItem>
                    <DropdownMenuItem>
                      <TriangleAlert /> Add Alert
                    </DropdownMenuItem>
                    <DropdownMenuItem>
                      <Pin /> Pin to Dashboard
                    </DropdownMenuItem>
                    <DropdownMenuItem>
                      <Share2 /> Share
                    </DropdownMenuItem>
                    <DropdownMenuSeparator />
                    <DropdownMenuItem variant="destructive">
                      <Trash /> Remove
                    </DropdownMenuItem>
                  </DropdownMenuContent>
                </DropdownMenu>
              </CardToolbar>
            </CardHeader>
            <CardContent className="space-y-2.5 z-10 relative">
              <div className="flex items-center gap-2.5">
                <span className="text-2xl font-semibold tracking-tight">
                  {stat.format ? stat.format(stat.value) : stat.prefix + formatNumber(stat.value) + stat.suffix}
                </span>
                <Badge className="bg-white/20 font-semibold">
                  {stat.delta > 0 ? <ArrowUp /> : <ArrowDown />}
                  {stat.delta}%
                </Badge>
              </div>
              <div className="text-xs text-white/80 mt-2 border-t border-white/20 pt-2.5">
                Vs last month:{' '}
                <span className="font-medium text-white">
                  {stat.lastFormat
                    ? stat.lastFormat(stat.lastMonth)
                    : stat.prefix + formatNumber(stat.lastMonth) + stat.suffix}
                </span>
              </div>
            </CardContent>
          </Card>
        ))}
      </div>
    </div>
  );
}
More by Sean Hello
View all

3D Testimonails
3.3K
Line Charts 9
637
Alert
492
Area Charts 1
385
Line Charts 6
384
Scroll Area
376
Area Charts 2
317
Navigation Menu
305
More in Cards
View all

Course Design Cards
1.1K
Card
70
Stats cards with links
39
The Item one
3

Card Studio
7
Statistics Card 7
292

Item
10
Dashboard with Collapsible Sidebar
2.4K

