
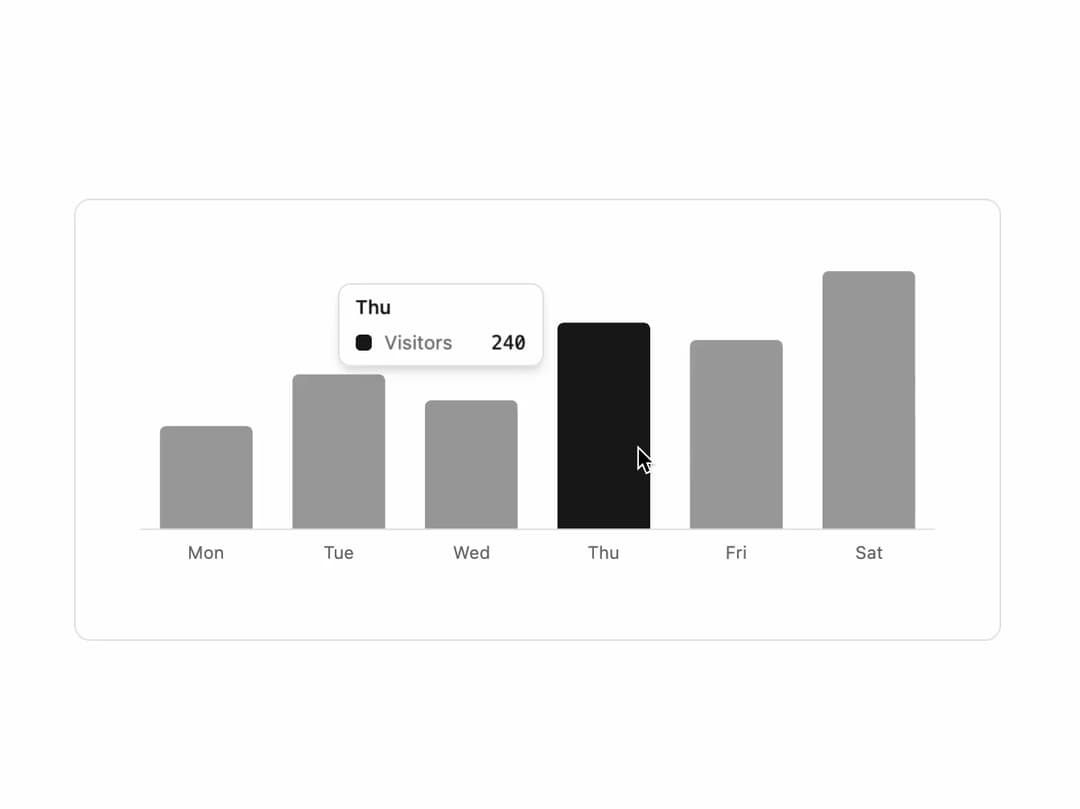
About
An accessible SVG bar chart for one data series that renders vertical or horizontal bars with a hover/focus tooltip and full keyboard navigation.
Built with React and Tailwind. Copy the prompt and paste it into Claude Code, Cursor or Lovable: your agent adds Bar Chart to your project and fits it to your theme.
Code
How Bar Chart is used: the demo's code. The component's own source comes with a free account.
Usage.tsx
import BarChart from "@/components/ui/bar-chart";

export default function BarChartDemo() {
  return (
    <div className="flex w-full items-center justify-center p-10">
      <div className="w-full max-w-xl rounded-lg border bg-background p-6 md:p-10">
        <BarChart
          name="Visitors"
          data={[120, 180, 150, 240, 220, 300]}
          labels={["Mon", "Tue", "Wed", "Thu", "Fri", "Sat"]}
        />
      </div>
    </div>
  );
}
More by kevingirelli
View all
Aurora
54
QR Code
49
Warp Gradient
48
FAQ Section
46
Wave Text
37
Corner Frame
36
Animated Border
32
Spotlight
23
More in Dashboards
View all
Dashboard with Collapsible Sidebar
2.4K

Sidebar
234

SaaS Template
2.4K

Chat template
598
Stats Bento
1.1K

Financial Bento Grid
71

Statistics Card 2
264

Course Design Cards
1.1K

