
About
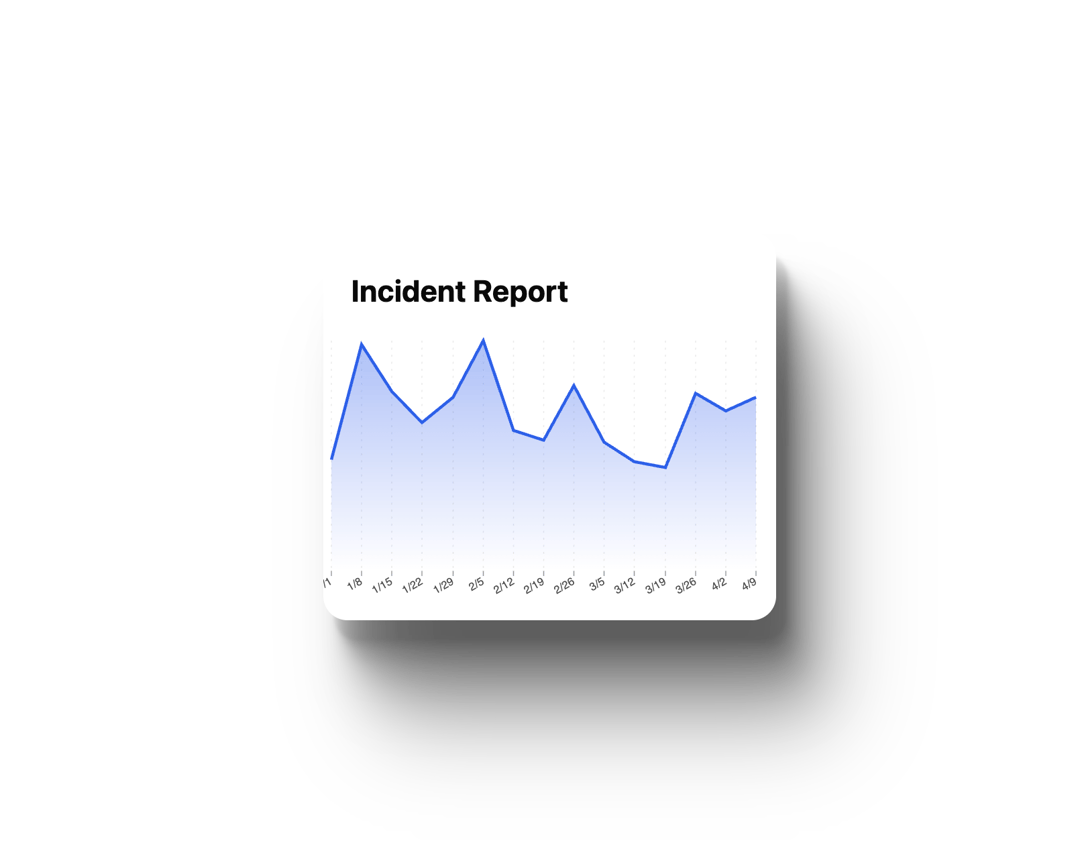
here is Area Chart Xsmall component
Built with React and Tailwind. Copy the prompt and paste it into Claude Code, Cursor or Lovable: your agent adds Area Chart Xs to your project and fits it to your theme.
Code
How Area Chart Xs is used: the demo's code. The component's own source comes with a free account.
Usage.tsx
// src/DemoOne.tsx

import React, { useState, useEffect } from 'react';
import { Component as AreaChartComponent, DataPoint } from '@/components/ui/area-chart-xs';
import { cn } from "@/lib/utils";

const generateDemoData = (): DataPoint[] => {
  const data: DataPoint[] = [];
  const startDate = new Date(2023, 0, 1);
  for (let i = 0; i < 15; i++) {
    const currentDate = new Date(startDate);
    currentDate.setDate(startDate.getDate() + i * 7);
    data.push({
      key: currentDate,
      data: Math.floor(Math.random() * 100) + 20,
    });
  }
  return data;
};

const areaSingleSeriesSimpleData: DataPoint[] = generateDemoData();

const DemoOne = () => {
  const [isDarkMode, setIsDarkMode] = useState(true);

  useEffect(() => {
    const root = window.document.documentElement;
    if (isDarkMode) {
      root.classList.add('dark');
    } else {
      root.classList.remove('dark');
    }
  }, [isDarkMode]);

  const toggleTheme = () => {
    setIsDarkMode(prevMode => !prevMode);
  };

  return (
    <div className={cn("flex w-full min-h-screen justify-center items-center p-8 bg-background text-foreground transition-colors duration-300")}>
      <div className="absolute top-4 right-4">
        <button
          onClick={toggleTheme}
          className={cn(
            "px-4 py-2 rounded-lg shadow font-medium border border-border",
            "bg-card text-card-foreground hover:bg-muted"
          )}
        >
          Toggle Theme (Current: {isDarkMode ? 'Dark' : 'Light'})
        </button>
      </div>
      <div
        className={cn(
            "flex flex-col pt-4 pb-4 rounded-3xl shadow-[11px_21px_3px_rgba(0,0,0,0.06),14px_27px_7px_rgba(0,0,0,0.10),19px_38px_14px_rgba(0,0,0,0.13),27px_54px_27px_rgba(0,0,0,0.16),39px_78px_50px_rgba(0,0,0,0.20),55px_110px_86px_rgba(0,0,0,0.26)] w-[450px] h-[386px] overflow-hidden",
            "bg-card"
        )}
      >
        <h3 className={cn("text-3xl text-left pl-7 pr-7 pt-6 pb-8 font-bold text-card-foreground")}>
          Incident Report
        </h3>
        <div className="flex-grow pl-2 pr-5 pb-2">
          <AreaChartComponent
            id="incidentReportChart"
            data={areaSingleSeriesSimpleData}
          />
        </div>
      </div>
    </div>
  );
};

export { DemoOne };
Dependencies
More by REAVIZ
View all
Funnel Chart Big
126
Heat Map XL
95
Area Chart
85
Stacked Diverging bar
76
Layered Chart XL
71
Hexagon map
69
Area Chart
69
Incident Report Large
54
More in Cards
View all

Statistics Card 2
264

Course Design Cards
1.1K
Card
70
Stats cards with links
39
The Item one
3

Card Studio
7
Statistics Card 7
292

Item
10
