About
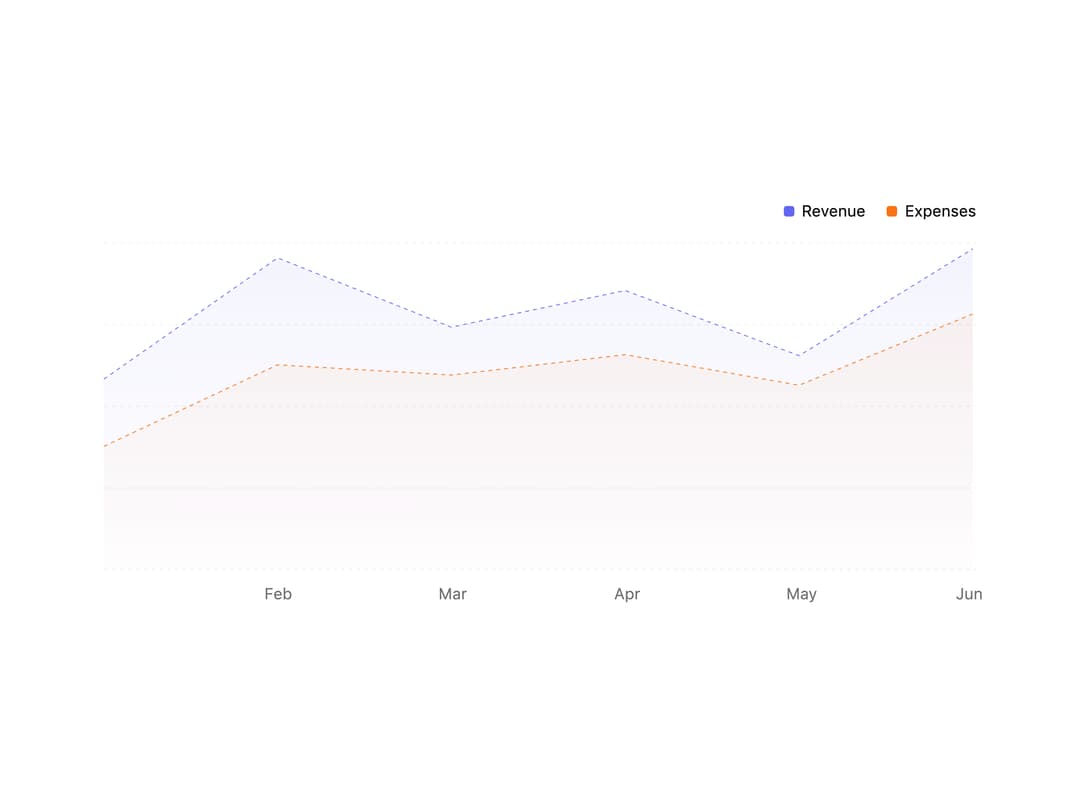
A styled area chart for visualizing trends over time with filled gradients, patterned fills, a zoom brush, selectable series, and a shimmering loading state.
Built with React and Tailwind. Copy the prompt and paste it into Claude Code, Cursor or Lovable: your agent adds Area Chart to your project and fits it to your theme.
Code
How Area Chart is used: the demo's code. The component's own source comes with a free account.
Usage.tsx
"use client";

import AreaChart from "@/components/ui/area-chart";

const chartConfig = {
  revenue: {
    label: "Revenue",
    colors: { light: ["#6366f1"], dark: ["#818cf8"] },
  },
  expenses: {
    label: "Expenses",
    colors: { light: ["#f97316"], dark: ["#fb923c"] },
  },
};

const data = [
  { month: "Jan", revenue: 186, expenses: 120 },
  { month: "Feb", revenue: 305, expenses: 200 },
  { month: "Mar", revenue: 237, expenses: 190 },
  { month: "Apr", revenue: 273, expenses: 210 },
  { month: "May", revenue: 209, expenses: 180 },
  { month: "Jun", revenue: 314, expenses: 250 },
];

export default function AreaChartDemo() {
  return (
    <div className="flex h-screen w-full items-center justify-center p-8">
      <AreaChart
        data={data}
        chartConfig={chartConfig}
        xDataKey="month"
        className="h-80 w-full max-w-2xl"
      />
    </div>
  );
}
Dependencies
More by corr
View all

Audit Log
83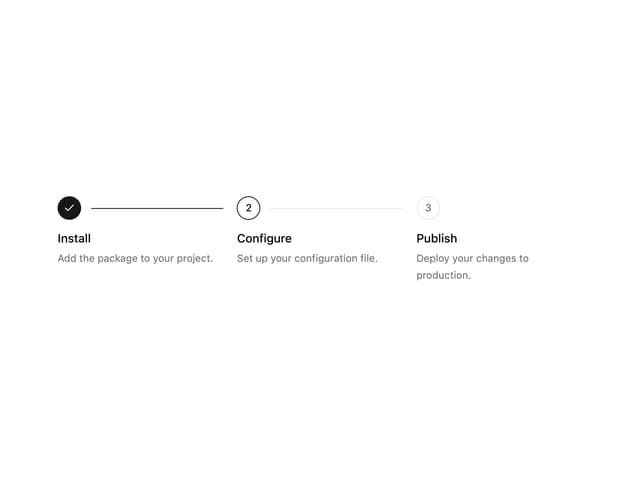
Stepper
59
Notice Alert
36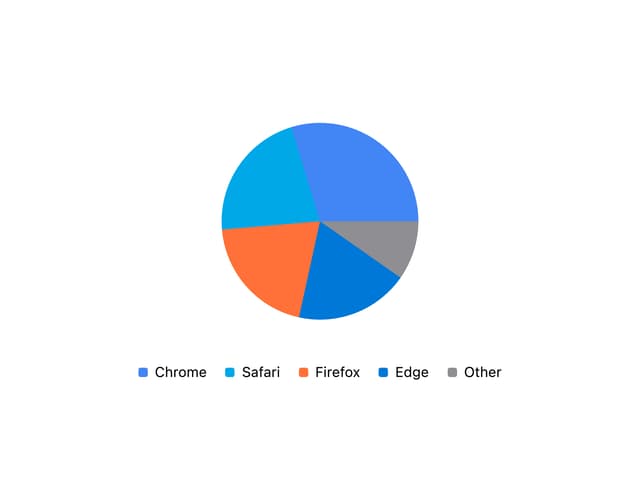
Pie Chart
8
Scroll Blur
8
Key Value List
7
Animated Spinner
3
Presence Fade
2
More in Dashboards
View all
Dashboard with Collapsible Sidebar
2.4K

Sidebar
234

SaaS Template
2.4K

Chat template
598
Stats Bento
1.1K

Financial Bento Grid
71

Statistics Card 2
264

Course Design Cards
1.1K

