
About
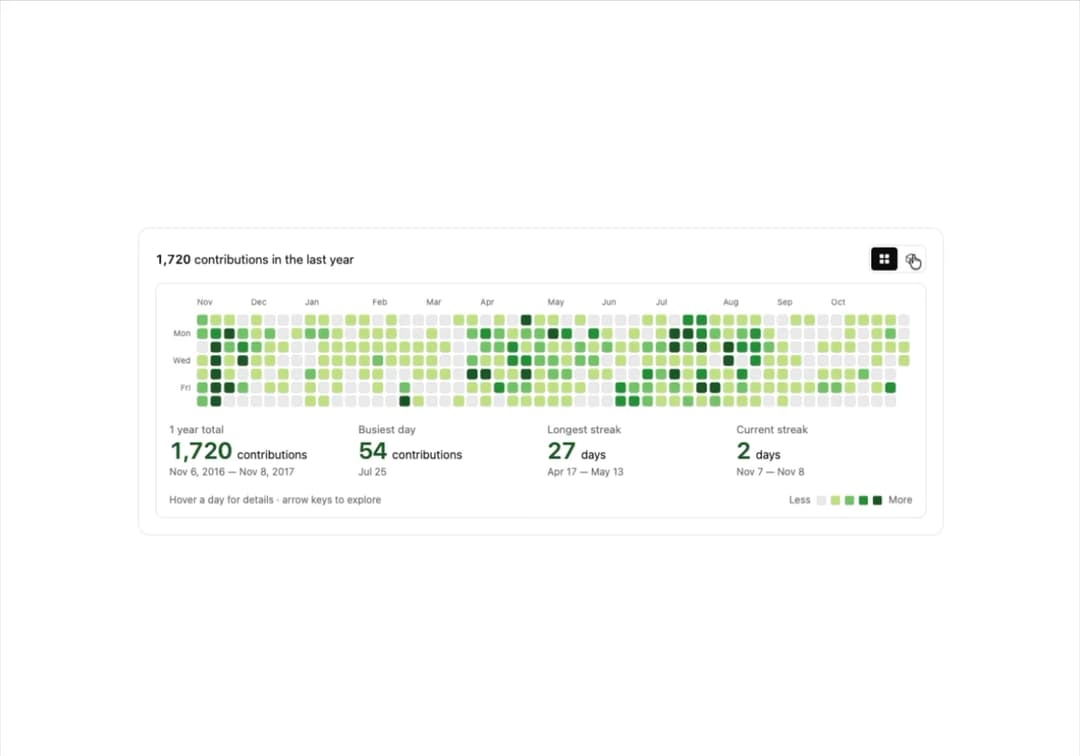
GitHub-style contribution graph that morphs into a 3D isometric skyline heatmap. Hover days for tooltips, drag to orbit, walk it with the keyboard, pick from six palettes, and read total, busiest-day and streak stats. Feed it your own date/count data. React only.
Built with React and Tailwind. Copy the prompt and paste it into Claude Code, Cursor or Lovable: your agent adds GitHub Contribution Graph 3D Heatmap to your project and fits it to your theme.
Code
How GitHub Contribution Graph 3D Heatmap is used: the demo's code. The component's own source comes with a free account.
Usage.tsx
"use client"

import ContributionSkyline from "@/components/ui/contribution-skyline"

export default function Demo() {
  // w-full is load-bearing: 21st centres every demo in a flex wrapper, and a
  // flex item left at width:auto shrinks to its contents.
  return (
    <div className="w-full bg-background px-4 py-10 sm:px-8">
      <div className="mx-auto w-full max-w-[980px]">
        <ContributionSkyline endDate="2017-11-08" />
      </div>
    </div>
  )
}
More by Kedhareswer Naidu
View all

Glassmorphism Folder Cards
2.5K
Morph Gallery
1.4K
Halftone Wordmark Footer
1.1K
Glass Cards
713
Hanging Polaroid Image Carousel
692
Particle Animation
641
Tiger Tear Reveal
623
3D CD Disc Carousel
464
More in Dashboards
View all
Dashboard with Collapsible Sidebar
2.4K

Sidebar
225

SaaS Template
2.4K
Stats Bento
1.1K

Financial Bento Grid
67
Stats cards with links
120

Course Design Cards
1.1K

Statistics Card 2
259


