
About
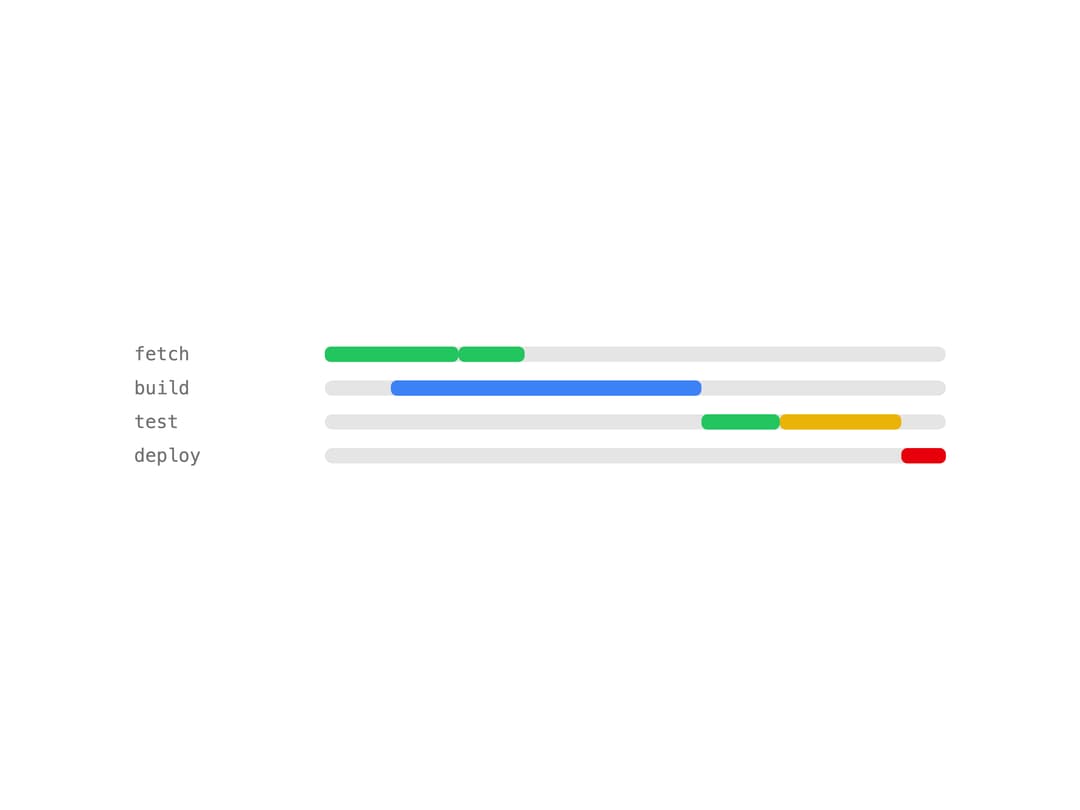
A horizontal chart that shows several workers on one shared time axis, each row a lane with colored segments for the stretches of work and their outcome.
Built with React and Tailwind. Copy the prompt and paste it into Claude Code, Cursor or Lovable: your agent adds Lanes to your project and fits it to your theme.
Code
How Lanes is used: the demo's code. The component's own source comes with a free account.
Usage.tsx
import Lanes from "@/components/ui/lanes";

export default function LanesDemo() {
  return (
    <div className="w-full max-w-xl bg-background p-6 text-foreground">
      <Lanes
        label="The workers of run 4127"
        lanes={[
          {
            id: "fetch",
            label: "fetch",
            spans: [
              { label: "reading files", start: 0, end: 1200, tone: "ok" },
              { label: "parsing", start: 1200, end: 1800, tone: "ok" },
            ],
          },
          {
            id: "build",
            label: "build",
            spans: [
              { label: "compiling", start: 600, end: 3400, tone: "running" },
            ],
          },
          {
            id: "test",
            label: "test",
            spans: [
              { label: "unit tests", start: 3400, end: 4100, tone: "ok" },
              { label: "e2e tests", start: 4100, end: 5200, tone: "warn" },
            ],
          },
          {
            id: "deploy",
            label: "deploy",
            spans: [{ label: "upload", start: 5200, end: 5600, tone: "error" }],
          },
        ]}
      />
    </div>
  );
}
More by keshon
View all
List
Thinking
Key Value List
Status Dot
Spinner
Note
Split