
About
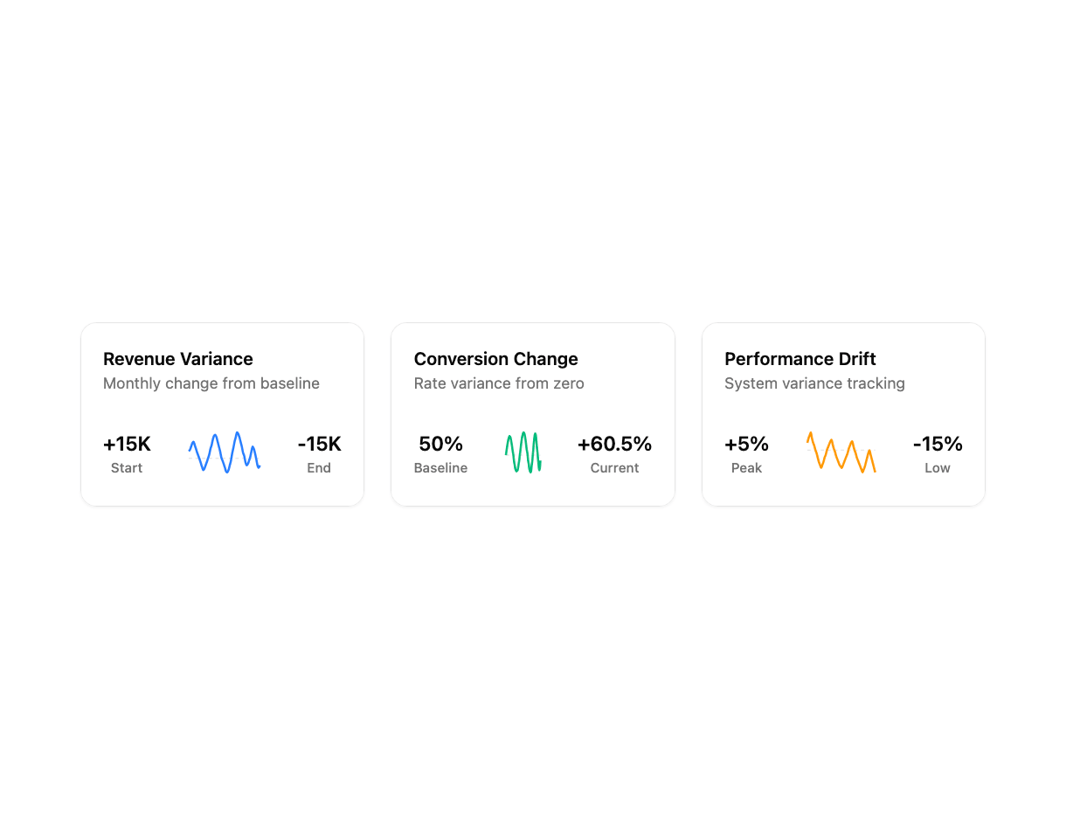
Line charts designed to present key metrics and insights. Each chart features unique layouts, data visualizations, and styling options. Perfect for dashboards, admin panels, and analytics pages.
Built with React and Tailwind. Copy the prompt and paste it into Claude Code, Cursor or Lovable: your agent adds Line Charts 8 to your project and fits it to your theme.
Code
How Line Charts 8 is used: the demo's code. The component's own source comes with a free account.
Usage.tsx
'use client';

import React from 'react';
import { Card, CardContent } from '@/components/ui/card';
import { Line, LineChart, ReferenceLine, ResponsiveContainer, Tooltip, YAxis } from 'recharts';

// Business Case 1: SaaS Revenue Tracking (Detailed wavy pattern with micro-fluctuations)
const revenueData = [
  { value: 15000 },
  { value: 18000 },
  { value: 25000 },
  { value: 32000 },
  { value: 35000 },
  { value: 28000 },
  { value: 20000 },
  { value: 12000 },
  { value: 5000 },
  { value: -2000 },
  { value: -10000 },
  { value: -18000 },
  { value: -25000 },
  { value: -22000 },
  { value: -15000 },
  { value: -8000 },
  { value: 0 },
  { value: 8000 },
  { value: 20000 },
  { value: 28000 },
  { value: 40000 },
  { value: 48000 },
  { value: 50000 },
  { value: 45000 },
  { value: 35000 },
  { value: 25000 },
  { value: 15000 },
  { value: 2000 },
  { value: -5000 },
  { value: -12000 },
  { value: -20000 },
  { value: -28000 },
  { value: -30000 },
  { value: -25000 },
  { value: -15000 },
  { value: -5000 },
  { value: 10000 },
  { value: 22000 },
  { value: 35000 },
  { value: 45000 },
  { value: 55000 },
  { value: 52000 },
  { value: 45000 },
  { value: 35000 },
  { value: 25000 },
  { value: 12000 },
  { value: 5000 },
  { value: -8000 },
  { value: -15000 },
  { value: -12000 },
  { value: -5000 },
  { value: 3000 },
  { value: 15000 },
  { value: 25000 },
  { value: 20000 },
  { value: 10000 },
  { value: -2000 },
  { value: -15000 },
  { value: -20000 },
  { value: -15000 },
];

// Business Case 2: E-commerce Conversion Rate (Detailed sine wave with micro-variations)
const conversionData = [
  { value: 0 },
  { value: 0.8 },
  { value: 1.5 },
  { value: 2.2 },
  { value: 2.8 },
  { value: 3.2 },
  { value: 3.5 },
  { value: 3.4 },
  { value: 3.2 },
  { value: 2.6 },
  { value: 2.0 },
  { value: 1.2 },
  { value: 0.5 },
  { value: -0.2 },
  { value: -1.2 },
  { value: -1.8 },
  { value: -2.5 },
  { value: -2.8 },
  { value: -3.0 },
  { value: -2.9 },
  { value: -2.8 },
  { value: -2.2 },
  { value: -1.5 },
  { value: -0.8 },
  { value: 0.2 },
  { value: 1.0 },
  { value: 2.0 },
  { value: 2.8 },
  { value: 3.5 },
  { value: 3.9 },
  { value: 4.2 },
  { value: 4.1 },
  { value: 3.8 },
  { value: 3.2 },
  { value: 2.5 },
  { value: 1.5 },
  { value: 0.8 },
  { value: 0.2 },
  { value: -1.0 },
  { value: -1.6 },
  { value: -2.5 },
  { value: -2.9 },
  { value: -3.2 },
  { value: -3.0 },
  { value: -2.0 },
  { value: -1.2 },
  { value: 0 },
  { value: 1.2 },
  { value: 2.5 },
  { value: 3.5 },
  { value: 4.0 },
  { value: 3.8 },
  { value: 2.8 },
  { value: 1.5 },
  { value: 0.5 },
  { value: -0.8 },
  { value: -2.0 },
  { value: -2.8 },
  { value: -2.5 },
  { value: -1.0 },
];

// Business Case 3: Server Performance Monitoring (Detailed oscillating decline with volatility)
const performanceData = [
  { value: 5 },
  { value: 8 },
  { value: 10 },
  { value: 12 },
  { value: 8 },
  { value: 5 },
  { value: 3 },
  { value: 0 },
  { value: -2 },
  { value: -5 },
  { value: -8 },
  { value: -10 },
  { value: -12 },
  { value: -10 },
  { value: -8 },
  { value: -5 },
  { value: -3 },
  { value: 0 },
  { value: 2 },
  { value: 4 },
  { value: 6 },
  { value: 7 },
  { value: 4 },
  { value: 1 },
  { value: -1 },
  { value: -4 },
  { value: -6 },
  { value: -8 },
  { value: -10 },
  { value: -11 },
  { value: -12 },
  { value: -10 },
  { value: -8 },
  { value: -6 },
  { value: -4 },
  { value: -2 },
  { value: 1 },
  { value: 3 },
  { value: 5 },
  { value: 6 },
  { value: 3 },
  { value: 0 },
  { value: -2 },
  { value: -5 },
  { value: -7 },
  { value: -9 },
  { value: -11 },
  { value: -13 },
  { value: -15 },
  { value: -13 },
  { value: -11 },
  { value: -8 },
  { value: -5 },
  { value: -2 },
  { value: 0 },
  { value: -3 },
  { value: -6 },
  { value: -9 },
  { value: -12 },
  { value: -15 },
];

// Use custom or Tailwind standard colors: https://tailwindcss.com/docs/colors
const businessCards = [
  {
    title: 'Revenue Variance',
    metric: 'Monthly change from baseline',
    baseValue: '+15K',
    baseCurrency: 'Start',
    targetValue: '-15K',
    targetCurrency: 'End',
    data: revenueData,
    change: 'Volatile',
    isPositive: false,
    color: 'var(--color-blue-500)',
  },
  {
    title: 'Conversion Change',
    metric: 'Rate variance from zero',
    baseValue: '50%',
    baseCurrency: 'Baseline',
    targetValue: '+60.5%',
    targetCurrency: 'Current',
    data: conversionData,
    change: 'Cyclical',
    isPositive: true,
    color: 'var(--color-emerald-500)',
  },
  {
    title: 'Performance Drift',
    metric: 'System variance tracking',
    baseValue: '+5%',
    baseCurrency: 'Peak',
    targetValue: '-15%',
    targetCurrency: 'Low',
    data: performanceData,
    change: 'Declining',
    isPositive: false,
    color: 'var(--color-amber-500)',
  },
];

export default function LineChart8() {
  return (
    <div className="w-full max-w-min-h-screen flex items-center justify-center p-6 lg:p-12">
      {/* Container */}
      <div className="@container grow w-full max-w-7xl">
        {/* Grid */}
        <div className="grid grid-cols-1 @3xl:grid-cols-3 gap-6">
          {/* Business Cards */}
          {businessCards.map((card, i) => (
            <Card key={i}>
              <CardContent className="flex flex-col gap-6">
                {/* Header */}
                <div className="flex flex-col">
                  <h3 className="text-base font-semibold text-foreground m-0">{card.title}</h3>
                  <p className="text-sm text-muted-foreground m-0">{card.metric}</p>
                </div>

                {/* Chart Section */}
                <div className="flex items-center justify-between">
                  {/* Left side - Base Currency */}
                  <div className="text-center">
                    <div className="text-lg font-semibold text-foreground">{card.baseValue}</div>
                    <div className="text-xs text-muted-foreground font-medium">{card.baseCurrency}</div>
                  </div>

                  {/* Center - Mini Chart */}
                  <div className="flex-1 h-14 mx-6 relative">
                    <ResponsiveContainer width="100%" height="100%">
                      <LineChart
                        data={card.data}
                        margin={{
                          top: 10,
                          right: 10,
                          left: 10,
                          bottom: 10,
                        }}
                      >
                        <YAxis domain={['dataMin', 'dataMax']} hide={true} />
                        <ReferenceLine y={0} stroke="var(--input)" strokeWidth={1} strokeDasharray="3 3" />
                        <Tooltip
                          cursor={{ stroke: card.color, strokeWidth: 1, strokeDasharray: '2 2' }}
                          position={{ x: undefined, y: undefined }}
                          offset={10}
                          allowEscapeViewBox={{ x: true, y: true }}
                          content={({ active, payload, coordinate }) => {
                            if (active && payload && payload.length && coordinate) {
                              const value = payload[0].value;
                              const formatValue = (val: number) => {
                                if (card.title === 'Revenue Variance') {
                                  return val >= 0 ? `+$${val.toLocaleString()}` : `-$${Math.abs(val).toLocaleString()}`;
                                } else if (card.title === 'Conversion Change') {
                                  return val >= 0 ? `+${val.toFixed(1)}%` : `${val.toFixed(1)}%`;
                                } else {
                                  return val >= 0 ? `+${val}%` : `${val}%`;
                                }
                              };

                              // Smart positioning logic
                              const tooltipStyle: React.CSSProperties = {
                                transform:
                                  coordinate.x && coordinate.x > 120 ? 'translateX(-100%)' : 'translateX(10px)',
                                marginTop: coordinate.y && coordinate.y > 30 ? '-40px' : '10px',
                              };

                              return (
                                <div
                                  className="bg-background/95 backdrop-blur-sm border border-border shadow-xl rounded-lg p-2.5 pointer-events-none z-50"
                                  style={tooltipStyle}
                                >
                                  <p className="text-sm font-semibold text-foreground leading-tight mb-1.5">
                                    {formatValue(value as number)}
                                  </p>
                                  <p className="text-xs text-muted-foreground leading-tight">{card.title}</p>
                                </div>
                              );
                            }
                            return null;
                          }}
                        />
                        <Line
                          type="monotone"
                          dataKey="value"
                          stroke={card.color}
                          strokeWidth={2}
                          dot={{
                            r: 0,
                            strokeWidth: 0,
                          }}
                          activeDot={{
                            r: 5,
                            fill: card.color,
                            stroke: 'white',
                            strokeWidth: 2,
                            filter: `drop-shadow(0 0 6px ${card.color})`,
                          }}
                        />
                      </LineChart>
                    </ResponsiveContainer>
                  </div>

                  {/* Right side - Target Currency */}
                  <div className="text-center">
                    <div className="text-lg font-semibold text-foreground">{card.targetValue}</div>
                    <div className="text-xs text-muted-foreground font-medium">{card.targetCurrency}</div>
                  </div>
                </div>
              </CardContent>
            </Card>
          ))}
        </div>
      </div>
    </div>
  );
}
More by Sean Hello
View all

3D Testimonails
3.3K
Line Charts 9
637
Alert
492
Area Charts 1
385
Line Charts 6
384
Scroll Area
376
Area Charts 2
317
Navigation Menu
305
More in Cards
View all
Statistics Card 2
264

Course Design Cards
1.1K
Card
70
Stats cards with links
39
The Item one
3

Card Studio
7
Statistics Card 7
292

Item
10
