

About
A GitHub style contribution graph with 365 day squares sharing one tooltip that glides between days, plus a reveal that ripples back from today. Use it for streaks, habit trackers and developer profiles.
Built with React and Tailwind. Copy the prompt and paste it into Claude Code, Cursor or Lovable: your agent adds GitHub Activity Grid to your project and fits it to your theme.
Code
How GitHub Activity Grid is used: the demo's code. The component's own source comes with a free account.
Usage.tsx
"use client";

import * as React from "react";
import { GitHubActivityGrid, mockActivityYear } from "@/components/ui/github-activity-grid";

const settings = {
  seed: 2026,
  cellSize: 11,
  cellGap: 3,
};

export default function Demo(props: Partial<typeof settings>) {
  const s = { ...settings, ...props };
  const days = React.useMemo(() => mockActivityYear(s.seed), [s.seed]);

  return (
    <div className="flex min-h-[360px] w-full items-center justify-center px-4 py-8">
      <div className="w-full max-w-3xl">
        <GitHubActivityGrid days={days} cellSize={s.cellSize} cellGap={s.cellGap} />
      </div>
    </div>
  );
}
Dependencies
More by Wensity Labs
View all

Sidebar
230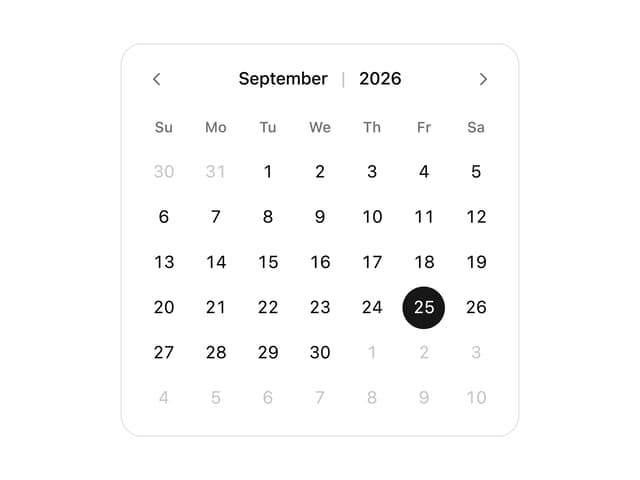
Calendar
171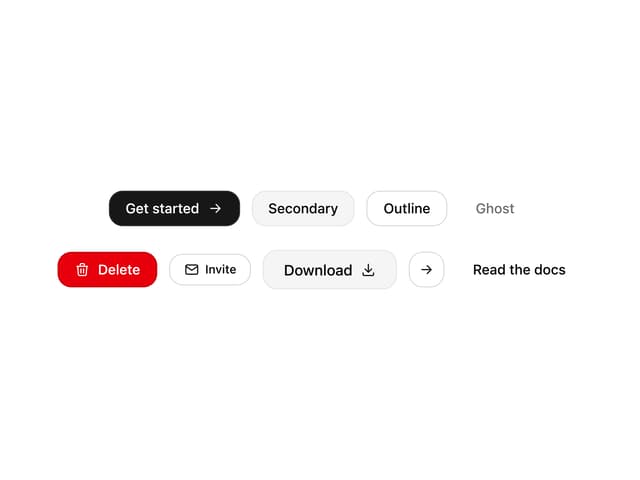
Button
76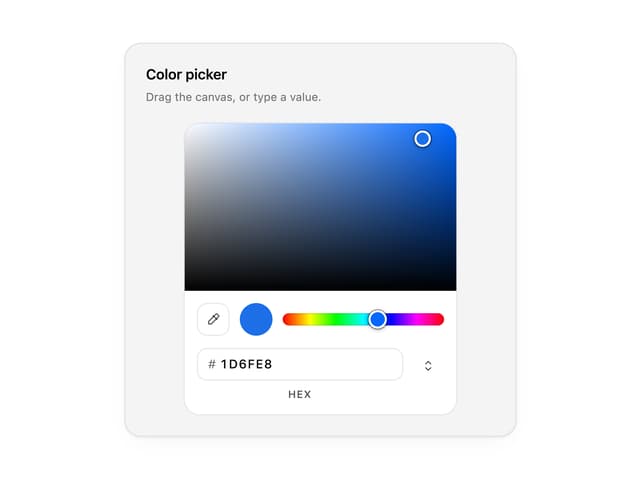
Color Picker
62
Image Comparison Slider
55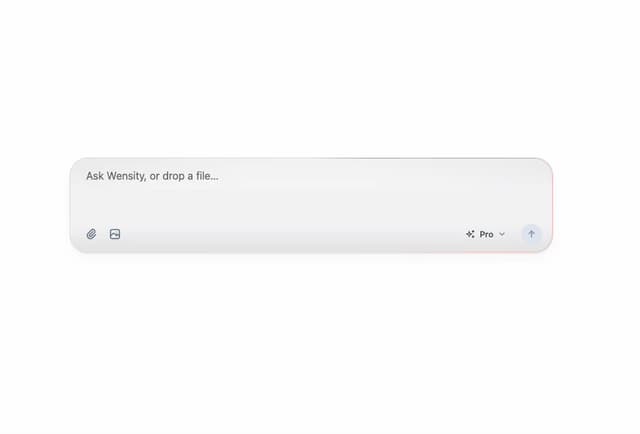
AI Prompt Input
50
Navigation Menu
36
Text Morphing
35
More in Dashboards
View all
Dashboard with Collapsible Sidebar
2.4K

SaaS Template
2.4K

Financial Bento Grid
70

Chat template
597
Stats Bento
1.1K

Statistics Card 2
263
Stats cards with links
39

Course Design Cards
1.1K


