
About
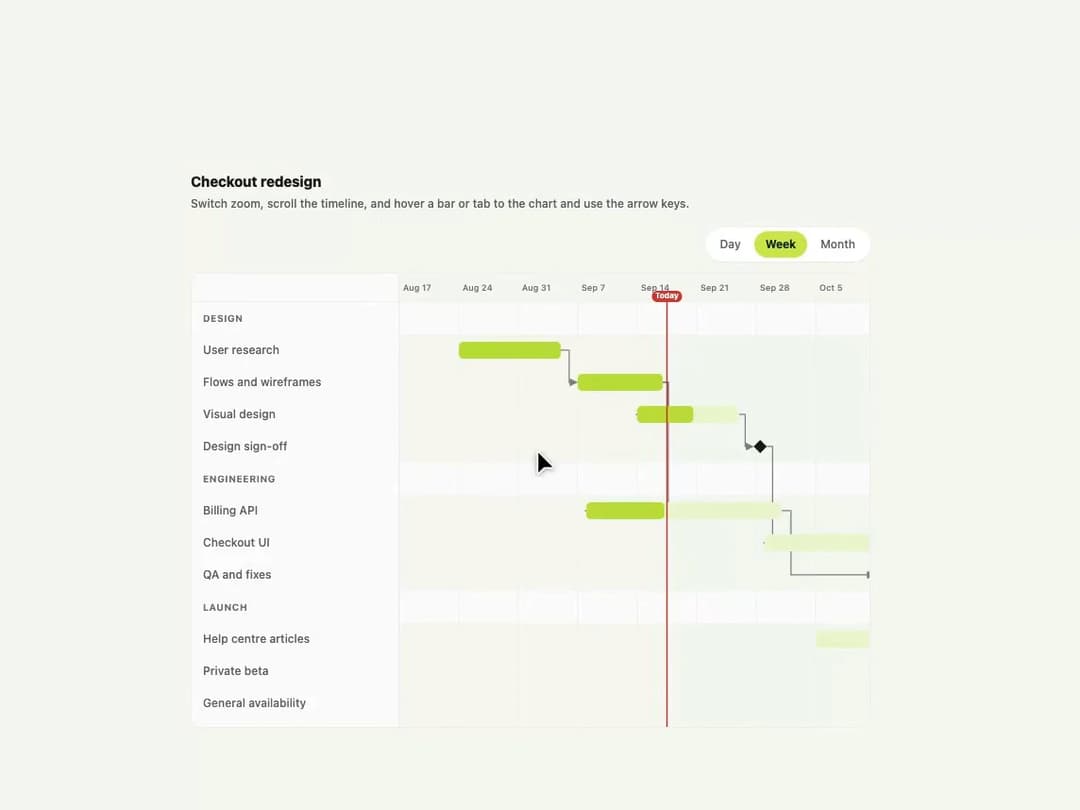
An accessible project-timeline chart that draws tasks as bars on a calendar, grouped by lane, with progress fills, dependency arrows, milestone diamonds, a today marker and day/week/month zoom.
Built with React and Tailwind. Copy the prompt and paste it into Claude Code, Cursor or Lovable: your agent adds Gantt Chart to your project and fits it to your theme.
Code
How Gantt Chart is used: the demo's code. The component's own source comes with a free account.
Usage.tsx
"use client";

import { GanttChart } from "@/components/ui/gantt-chart";
import { useState } from "react";

// Synthetic demo data — a fictional checkout-redesign project plan.
const TODAY = new Date(2026, 8, 17);
const day = (month, date) => new Date(2026, month - 1, date);

const LAUNCH = [
  {
    id: "research",
    lane: "Design",
    label: "User research",
    start: day(8, 24),
    end: day(9, 4),
    progress: 1,
  },
  {
    id: "flows",
    lane: "Design",
    label: "Flows and wireframes",
    start: day(9, 7),
    end: day(9, 16),
    progress: 1,
    dependsOn: ["research"],
  },
  {
    id: "visual",
    lane: "Design",
    label: "Visual design",
    start: day(9, 14),
    end: day(9, 25),
    progress: 0.55,
    dependsOn: ["flows"],
  },
  {
    id: "signoff",
    lane: "Design",
    label: "Design sign-off",
    start: day(9, 28),
    end: day(9, 28),
    milestone: true,
    dependsOn: ["visual"],
  },
  {
    id: "api",
    lane: "Engineering",
    label: "Billing API",
    start: day(9, 8),
    end: day(9, 30),
    progress: 0.4,
    dependsOn: ["flows"],
  },
  {
    id: "ui",
    lane: "Engineering",
    label: "Checkout UI",
    start: day(9, 29),
    end: day(10, 16),
    progress: 0,
    dependsOn: ["signoff"],
  },
  {
    id: "qa",
    lane: "Engineering",
    label: "QA and fixes",
    start: day(10, 12),
    end: day(10, 23),
    progress: 0,
    dependsOn: ["api", "ui"],
  },
  {
    id: "docs",
    lane: "Launch",
    label: "Help centre articles",
    start: day(10, 5),
    end: day(10, 21),
    progress: 0,
  },
  {
    id: "beta",
    lane: "Launch",
    label: "Private beta",
    start: day(10, 26),
    end: day(11, 6),
    progress: 0,
    dependsOn: ["qa"],
  },
  {
    id: "ga",
    lane: "Launch",
    label: "General availability",
    start: day(11, 10),
    end: day(11, 10),
    milestone: true,
    dependsOn: ["beta", "docs"],
  },
];

export default function GanttChartDemo() {
  const [zoom, setZoom] = useState("week");
  return (
    <div className="w-full max-w-3xl bg-canvas p-6">
      <h2 className="mb-1 text-[15px] font-extrabold tracking-[-0.01em] text-ink">
        Checkout redesign
      </h2>
      <p className="mb-4 text-[12px] font-medium text-ink-soft">
        Switch zoom, scroll the timeline, and hover a bar or tab to the chart
        and use the arrow keys.
      </p>
      <GanttChart
        tasks={LAUNCH}
        zoom={zoom}
        onZoomChange={setZoom}
        today={TODAY}
        label="Checkout redesign plan from late August to general availability on 10 November"
      />
    </div>
  );
}
More by klyv-ui
View all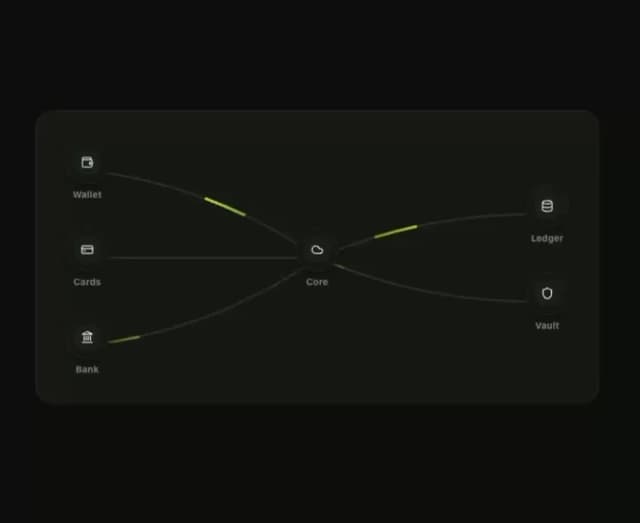
Klyv Animated Beam
47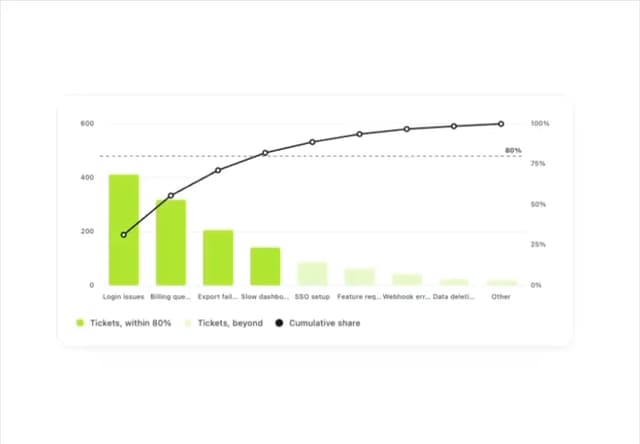
Pareto Chart
40
Shader Canvas
35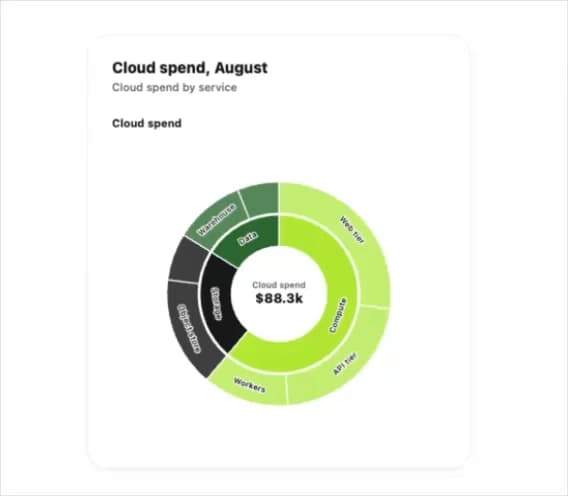
Sunburst Chart
23
Morphing Text
21
Gooey Loader
19
Gravity Tags
17
Klyv Border Beam
12