
About
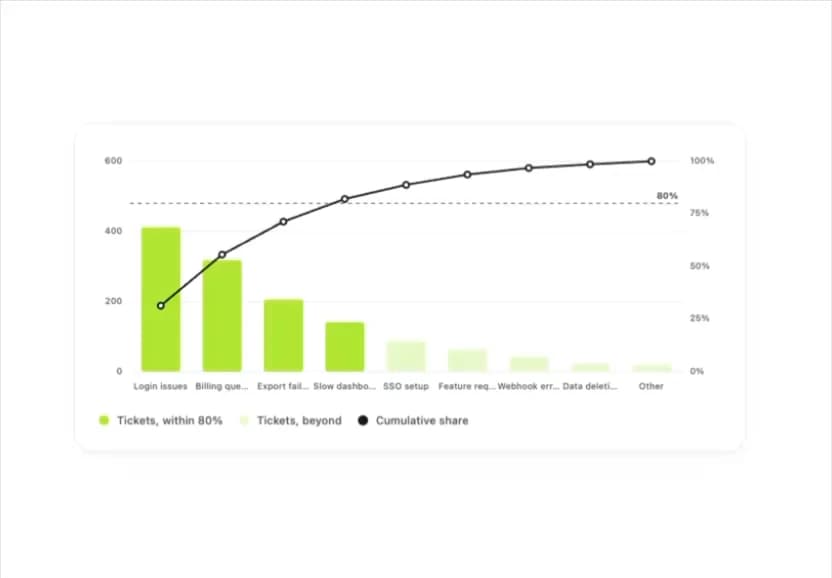
A ranked bar chart with a cumulative-share line that highlights the few categories accounting for most of a total, for prioritizing support tickets, defect causes, or churn reasons.
Built with React and Tailwind. Copy the prompt and paste it into Claude Code, Cursor or Lovable: your agent adds Pareto Chart to your project and fits it to your theme.
Code
How Pareto Chart is used: the demo's code. The component's own source comes with a free account.
Usage.tsx
import ParetoChart from "@/components/ui/pareto-chart";

export default function ParetoChartDemo() {
  return (
    <div className="w-full max-w-2xl rounded-[var(--radius-card)] border border-line bg-surface p-6 shadow-[var(--shadow-card)]">
      <ParetoChart
        items={[
          { label: "Login issues", value: 412 },
          { label: "Billing question", value: 318 },
          { label: "Export failed", value: 206 },
          { label: "Slow dashboard", value: 141 },
          { label: "SSO setup", value: 88 },
          { label: "Feature request", value: 64 },
          { label: "Webhook errors", value: 41 },
          { label: "Data deletion", value: 23 },
          { label: "Other", value: 19 },
        ]}
        label="Support tickets by reason, September"
        valueLabel="Tickets"
      />
    </div>
  );
}
More by klyv-ui
View all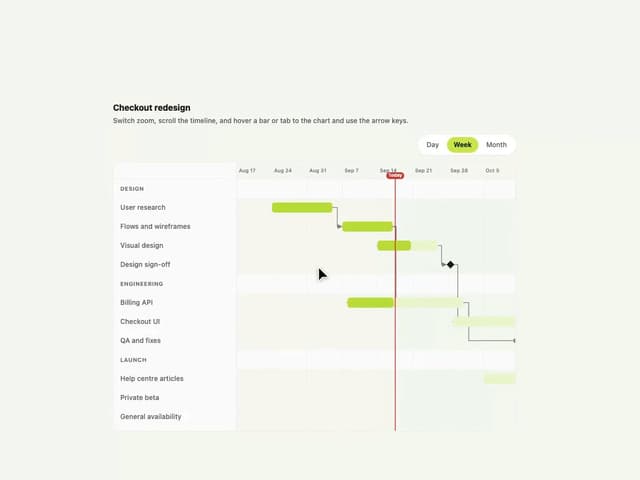
Gantt Chart
56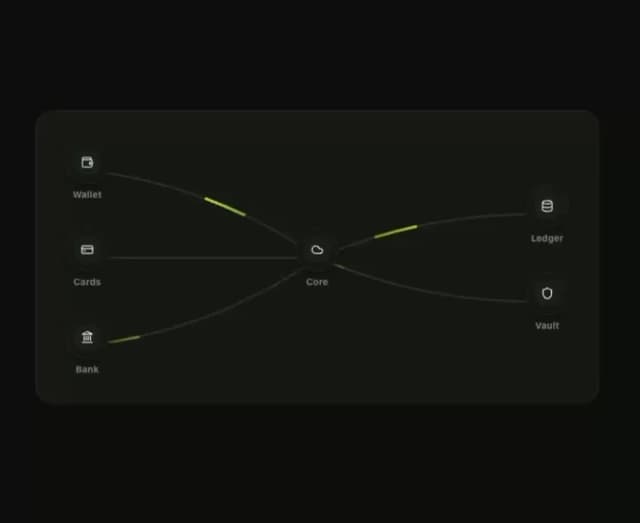
Klyv Animated Beam
47
Shader Canvas
35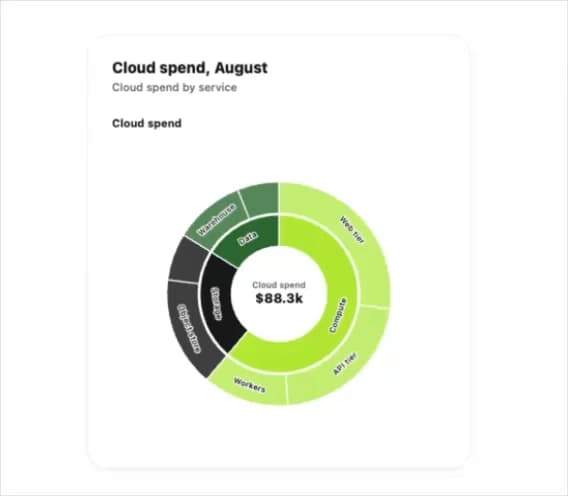
Sunburst Chart
23
Morphing Text
21
Gooey Loader
19
Gravity Tags
17
Klyv Border Beam
12